RBSE Solutions for Class 9 Maths Chapter 15 Statistics Additional Questions is part of RBSE Solutions for Class 9 Maths. Here we have given Rajasthan Board RBSE Class 9 Maths Solutions Chapter 15 Statistics Additional Questions.
| Board | RBSE |
| Textbook | SIERT, Rajasthan |
| Class | Class 9 |
| Subject | Maths |
| Chapter | Chapter 15 |
| Chapter Name | Statistics |
| Exercise | Additional Questions |
| Number of Questions Solved | 32 |
| Category | RBSE Solutions |
Rajasthan Board RBSE Class 9 Maths Solutions Chapter 15 Statistics Additional Questions
Multiple Choice Questions
Question 1.
In the given frequency (RBSESolutions.com) distribution table,
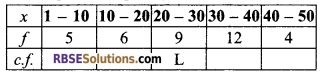
The value of L is equal to:
(a) 20
(b) 16
(c) 32
(d) 36
Answer
A
Question 2.
The upper limit of the class 20 – 29 is equal to:
(a) 22
(b) 29
(c) 22.5
(d) 29.5
Answer
B
![]()
Question 3.
The class mark (RBSESolutions.com) of the class 15.5 – 25.5 is equal to:
(a) 41
(b) 20
(c) 20.5
(d) 5
Answer
C
Question 4.
In the given ungrouped data 5, 4, 3, 1, 5, 3, 2, 5, 5, 1, 5, 5, the frequency of 5 is equal to:
(a) 6
(b) 3
(c) 4
(d) 2
Answer
A
Question 5.
In an inclusive form of frequency (RBSESolutions.com) distribution the true lower limit of a class is always obtained by subtracting:
(a) 1
(b) 1.5
(c) 0.5
(d) None
Answer
C
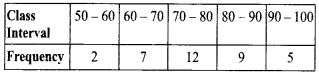
Question 6.
The cumulative frequency of the variable 16 will be, if distribution is:
(a) 15
(b) 17
(c) 22
(d) 21
Answer
D
Question 7.
In the given distribution 13, 8, 6, 10, 17, 8, 9, 12, the (RBSESolutions.com) range will be:
(a) 11
(b) 6
(c) 8
(d) 17
Answer
A
Question 8.
The range is defined as:
(a) the product of lower limit and upper limit
(b) the average of the (RBSESolutions.com) lowest and highest frequency
(c) the difference of maximum and minimum values from the data
(d) None of the above
Answer
C
Question 9.
Mid-value of a class can be defined as:
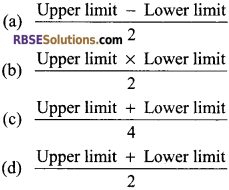
Answer
D
![]()
Very Short Answer Type Questions
Question 1.
What is (RBSESolutions.com) an individual series?
Solution.
In an individual series, the original value of each individual item or limit is written separately. In such series, frequency of each item or value is one.
Question 2.
What is exclusive series?
Solution.
In exclusive series, the upper limit of the previous class is the same as the lower limit of the next class. In exclusive series, the upper limit of a class are not included in that class.
For example: In the class 5 – 10, 10 is not included. Similarly, in 10 – 20, 20 is not included.
Question 3.
What is inclusive (RBSESolutions.com) series?
Solution.
In inclusive series, both the limits of a class are included in that class.
For example: In 0 – 9, 0 and 9 both are included. Similarly, in 10 – 19, 10 and 19 both are included.
Question 4.
How many types of series are there on the basis of quantitative/numerical classification? Sol. On the basis of quantitative or numerical classification, series can be divided into three parts namely
(i) Individual Series
(ii) Discrete Series
(iii) Continuous Series
Question 5.
Make class intervals from the (RBSESolutions.com) following mid-values:
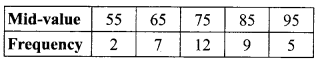
Solution.
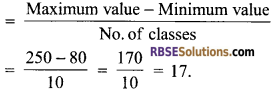
Question 6.
Wages of 100 labours are given. If the (RBSESolutions.com) maximum wages is ₹ 250 and minimum wages is ₹ 80 and it is divided in 10 classes, then how will you find the class width.
Solution.
![]()
Question 7.
What is cumulative frequency?
Solution.
Cumulative frequency corresponding to (RBSESolutions.com) a class is the sum of all frequencies, prior to that class, and the frequency of that class.
Question 8.
Prepare a cumulative frequency table for the given distribution.
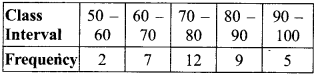
Solution.
Question 9.
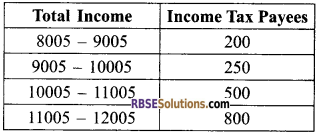
Change the following frequency (RBSESolutions.com) distribution in exclusive method.
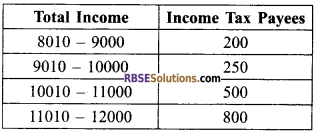
Solution.
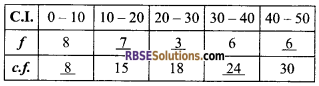
Question 10.
Fill in the blanks in (RBSESolutions.com) the following table:
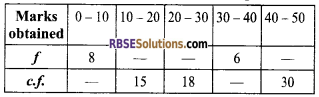
Solution.
![]()
Short Answer Type Questions
Question 1.
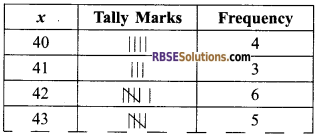
The following are the number (RBSESolutions.com) of books sold daily in the month of April by a book seller.
40, 50, 42, 43, 40, 45, 50, 43, 42, 50, 46, 41, 44, 46, 45, 50, 40, 41, 42, 43, 50, 42, 43, 44.
Prepare a frequency table of the above distribution.
Solution.
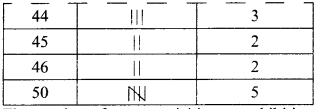
Question 2.
The number of persons visiting an exhibition (RBSESolutions.com) daily (in hundreds) in the month of September are as follows:
11, 12. 13, 14, 23, 17, 13, 17, 21, 13, 21, 23, 13, 17, 21, 19, 21, 13, 19, 21, 17, 19, 19, 21, 21, 19, 21, 19, 11, 19.
Prepare a frequency table for the above data.
Solution.
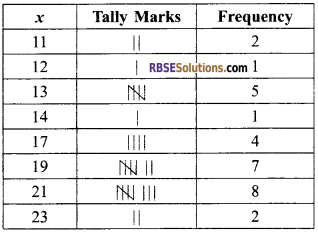
Question 3.
Weight of 40 persons (in kg) are given (RBSESolutions.com) as follows:
62, 61, 65, 62, 70, 62, 70, 75, 72, 80, 90, 80, 85, 70, 62, 63, 62, 80, 90, 70, 60, 70, 70, 62, 65, 70, 65, 94, 62, 65, 72, 70, 75, 80, 85, 63, 65, 90, 80, 85.
Prepare a frequency table of the above data taking 5 as the width of the class interval.
Solution.
Minimum weight = 60 kg
Maximum weight = 94 kg
Range = 94 – 60 = 34 kg
Number of class intervals with class size 5 = \(\frac { 34 }{ 5 }\) = 6.8 i.e. 7
Question 4.
The mean of 20 observations is 50. If the observation 50 is replaced by 140, what will be (RBSESolutions.com) the resulting mean or new mean?
Solution.
Number of observations = 20
Mean of these observations = 50
i.e. \(\bar { x }\) = 50
Sum of the observations = 20 x 50 = 1000
50 is replaced by 140.
New sum of the observations = 1000 – 50 + 140 = 1090
New mean = \(\frac { 1090 }{ 20 }\) = 54.5.
Question 5.
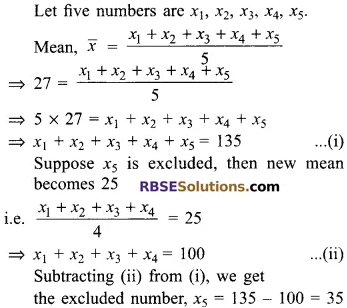
The mean of five numbers is 27. If one number is excluded, then (RBSESolutions.com) the new mean is 25. Find the excluded number.
Solution.
![]()
Question 6.
If the mean of the following (RBSESolutions.com) data is 9.2, find the value of p.
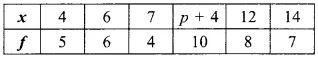
Solution.
The given data can be rewritten as below:
Question 7.
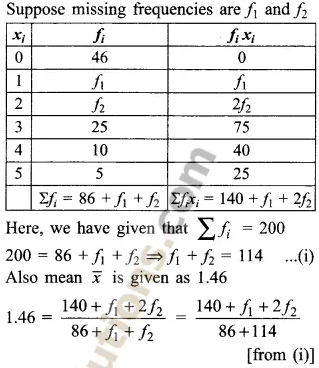
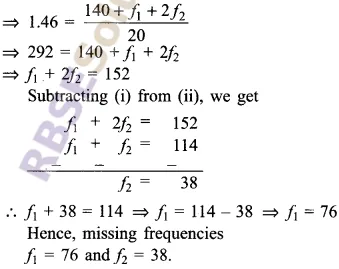
Find the missing frequencies (RBSESolutions.com) in the following frequency distribution, if the mean of the distribution is 1.46.
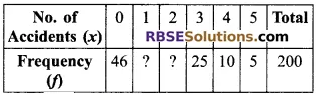
Solution.
Suppose missing frequencies are f1 and f2
Question 8.
The numbers 42, 43, 44, 44, (2x + 3), 45, 45, 46, 47 have (RBSESolutions.com) been put in the ascending order. If the median is 45, find x. Hence, find the mode of the above data.
Solution.
The given observations in ascending order are
42, 43, 44, 44, (2x + 3), 45, 45, 46, 47
Here, number of observations is 9 which is odd. So there will be one median class
i.e. \(\left( \frac { n+1 }{ 2 } \right)\) th term
Median = Value of \(\left( \frac { n+1 }{ 2 } \right)\) th term
\(\left( \frac { 9+1 }{ 2 } \right)\) th term = 5th term
⇒ Median = 2x + 3
But Median = 45 (given)
45 = 2x + 3
⇒ 2x = 42
⇒ x = 21
The observations are 42, 43, 44, 44, 45, 45, 45, 46, 47.
The number 45 occurs most frequently i.e. 3 times.
Hence, Mode of the above data is 45.
Hence, x = 21 and Mode = 45.
Question 9.
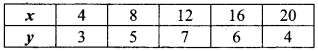
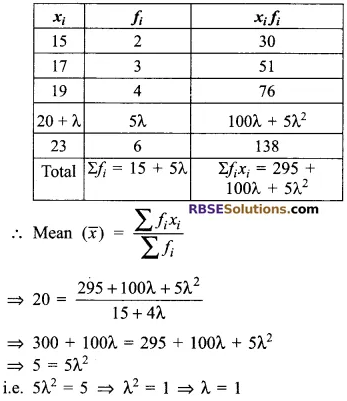
Find the value of λ. if the mean (RBSESolutions.com) of the following distribution is 20.
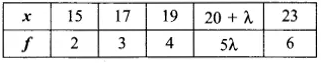
Solution.
Mean of the given data is 20. Now, by using direct method, we have
![]()
Long Answer Type Questions
Question 1.
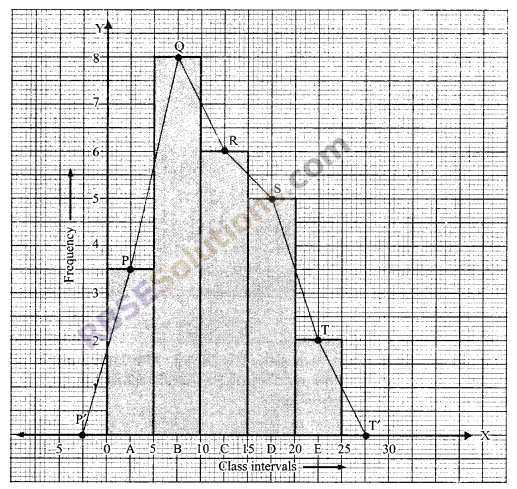
Draw the histogram and frequency polygon (RBSESolutions.com) of the following distribution:
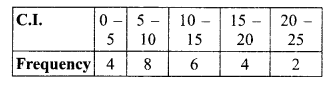
Solution.
The given frequency distribution is grouped and continuous, so we construct a histogram. After that we join the middle points i.e., P, Q, R, S, T of upper horizontal lines of rectangles A, B, C, D, E respectively by straight lines. Since nothing is said here about initial and last intervals, so join the end points with the middle points of these intervals on the x-axis. We, thus, obtained the frequency polygon P’PQRSTT’ for the given frequency distribution.
Question 2.
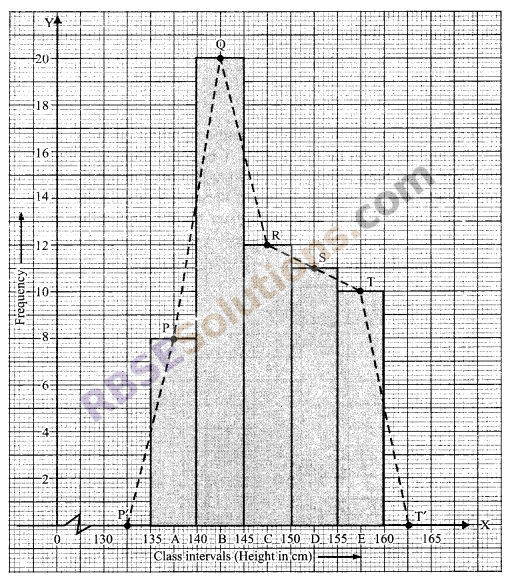
Draw the histogram and frequency polygon (RBSESolutions.com) of the following distribution:
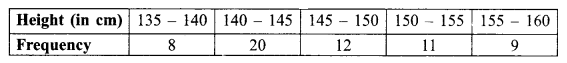
Solution.
The given frequency distribution is grouped and continuous, so we construct a histogram. After that, we join the middle points i.e., P, Q, R, S, T of upper horizontal lines of rectangles A, B, C, D, E, respectively by straight lines. Since nothing is said here about initial and last intervals, so we join the endpoints with the middle points of these intervals on the x-axis. We, thus, obtained the frequency polygon P’PQRSTT’ for the given frequency distribution.
Question 3.
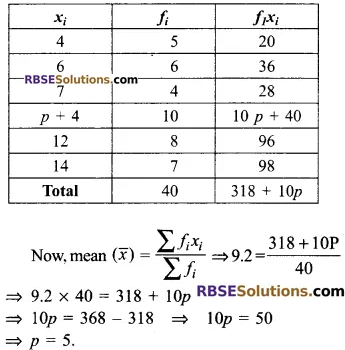
The mean weight of 180 students in (RBSESolutions.com) a school is 50 kg. The mean weight of boys is 60 kg, while that of girls is 45 kg. Find the number of boys and that of the girls in the school.
Solution.
Suppose the number of boys in the school be x.
Then, number of girls = (180 – x)
Total weight of 180 students = Total weight of x boys + Total weight of (180 – x) girls
180 × 50 = 60 × x + (180 – x) – 45
⇒ 9000 = 60x + 8100 – 45x
⇒ 9000 – 8100 = 15x
⇒ 15x = 900
⇒ x = 60
Hence, number of boys in the school = 60
and the number of girls = 180 – 60 = 120.
![]()
Question 4.
100 surnames were randomly picked up from (RBSESolutions.com) a local telephone directory and a frequency distribution of the number of letters in the English alphabet in the surnames was found as follows:
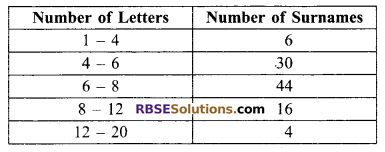
(i) Draw a histogram to depict the given information.
(ii) Write the class interval in which the maximum number of surnames lie.
Solution.
(i) Here, the width of the classes are not the same. So, we first adjust the length of the rectangles. The following frequency table shows the adjusted frequencies.
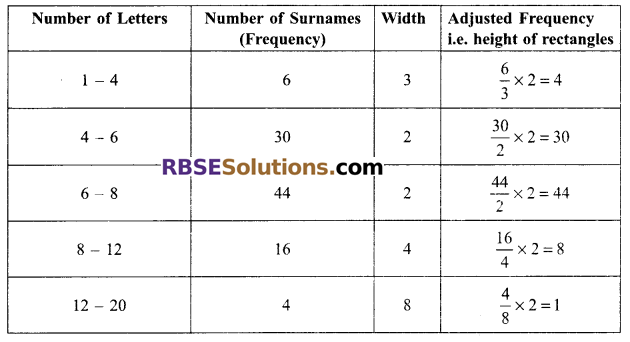
Required Histogram is (RBSESolutions.com) as under:
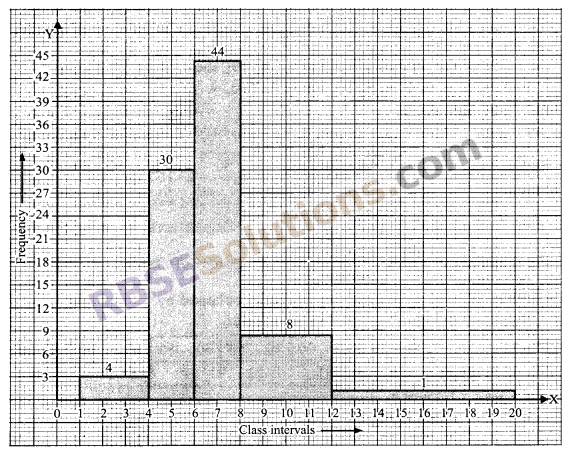
(ii) In the interval (6 – 8), the maximum number (RBSESolutions.com) of surnames lie.
![]()
We hope the given RBSE Solutions for Class 9 Maths Chapter 15 Statistics Additional Questions will help you. If you have any query regarding RBSE Rajasthan Board Solutions for Class 9 Maths Chapter 15 Statistics Additional Questions, drop a comment below and we will get back to you at the earliest.