
Make use of our RBSE Class 12 Accountancy Notes here to secure higher marks in exams.
Rajasthan Board RBSE Class 12 Accountancy Notes Chapter 10 Analysis of Financial Statements
Meaning of Financial Statement Analysis
Financial statement analysis is an important part of the overall financial analysis, it is based on the financial statement i.e., balance sheet and statement of profit and loss which are the end products of accounting process. Analysis of financial statements is a systematic process of analysing the financial information in the financial statements to understand and make decisions regarding the operations of the enterprise.
The analysis of financial statements is a study of relationship among various financial figures as set out in the financial statements i.e„ Balance sheet and statement of profit and loss. The complex data given in these financial statements is divided or broken into simple and valuable elements and relationship are established between the elements of the same statement or different financial statements. This process of division, establishing relationships and interpretation there of to understand the working and financial position of a business is known as Analysis of Financial Statements.
“Financial statement analysis is largely a study of relationship among the various financial factors in a business, as disclosed by a single set of statements and a study of trends of these factors, as shown in a series of statements.” Myer
“The analysis and interpretation of financial statements are an attempt to determine the significance and meaning of financial statement data so that the forecast may be made of the prospects for future earnings, ability to pay interest and debt maturities (both current and long term) and profitability and sound dividend policy.” Kennedy and Muller According to Indian Company Act, 2013, Section 2 (40), following financial Statement prepared by A company :
- Balance Sheet
- Profit & Loss A/c or Income Statement
- Cash Flow Statement
- Notes to Accounts and Explanatory Notes.
![]()
Objectives of Financial Statement Analysis
The purpose of financial analysis depends on the needs of the person who is analysing these statements. These varying needs may be :
(1) To Measure the Earning Capacity or Profitability
According to Robert Anthony, “The overall objective of a business is to earn a satisfactory return on the funds invested in it, consistent with maintaining a sound financial position.” Financial analysis helps in ascertaining whether adequate profits are being earned on the capital invested in the business. It is also disclosed by analysis of financial statements whether these profits are increasing or decreasing over the years. For this purpose the financial statements of a few years are taken into account to compute the change in profits over the years. Such analysis helps in ascertaining the future profitability or earning capacity of the business.
(2) To Measure the Solvency
It can be ascertained from financial analysis whether the business is in a position to pay its short term and long term liabilities in time. For example, the liquidity ratio (current ratio and quick ratio) are calculated to ascertain whether the business enterprise has sufficient liquid funds to meet its short term liabilities and debt equity ratio is calculated to ascertain whether the business enterprise has got the ability to repay the long term liabilities.
(3) To Measure the Financial Strength
To purpose of financial analysis is to assess the financial potential of the business. Analysis helps in providing answers to the following questions :
Funds required for the purchase of new machinery and equipments will be available from internal resources of the business or not.
Based on the current reputation of the business, how much funds can be raised from external sources?
(4) To Make Comparative Study with other Firms The purpose of financial analysis is to help the management to make a comparative study of the profitability of various firms engaged in same trade. Such comparison helps the management to study the position of their firm in respect of sales, expenses, profitability and working capital etc., in comparison to other firms.
(5) To Measure the Capability of Payment of Interest and Dividend The purpose of analysis is to assess whether the firm will have sufficient profits to pay the amount of interest in time and whether it has the capacity to pay the dividend in future at a higher rate. Analysis also indicates the number of times the profit is in comparison to interest. Analysis further indicates the extent to which the profit of the firm may decrease without in any way affecting its ability to meet interest and dividend obligations.
(6) To Identify the Trend of the Business When data about sales, cost of production, profits etc. are compared for two or more years of a firm, they indicate the direction in which a business in moving. If sales are increasing continuously alongwith increase in profit margins, it is an indication of a healthy growth trend of the business. Such analysis helps in ascertaining whether the business is progressive or not.
(7) To Judge the Efficiency of Management The purpose of financial analysis is to judge that the financial policies adopted by the management are proper or not. For example, if the actual ratio calculated on the basis of financial statements are in accordance with their standard ratio, the policies of the management may be said to be proper and efficient.
(8) To Provide Useful Information to the Management The object of financial analysis is to find out the shortcomings of the business, so that the management can take remedial measures to remove those shortcomings.
- Process of Financial Statement Analysis
- It gives the structural relationship of various items in the financial statements. The main functions which are used in the process of analysis and interpretation
- Rearrangement of Financial Statements
For analysis it is necessary to reclassify the complex data contained in the financial statements into purposive classes so that maximum desired information from every data for analysis can be obtained. Reclassification and rearrangement of different data depends upon the purpose of analysis.
![]()
Comparison
- After the classification of data of financial statements into different categories, it is necessary to obtain comparative data of the same enterprise of the part periods, if it is a time series analysis. In case of cross sectional analysis, it is necessary to obtain comparative data of the same accounting period of similar or comparable enterprises. For this a comparative study is necessary.
Analysis
- Comparative financial data are then analysed with reference to financial characteristics like profitability, solvency and liquidity.
Interpretation
- The concluding part of financial statement analysis is interpretation of financial information generated in the process of financial statement analysis. The interpretation should be precise and directed towards indicating the movement of various financial characteristics.
- Type of Financial Statement Analysis
![]()
Financial statement analysis can be classified into four categories :
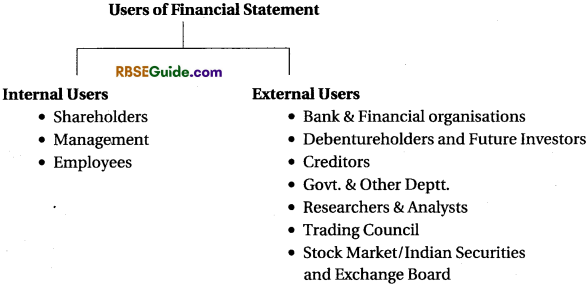
(i) External Analysis
External analysis is conducted by those who do not have access to the detailed records of an enterprise and therefpre, have to depend on published accounts i.e., statement of profit and loss, balance sheet, directors and auditor’s reports, such type of analysis is made by investors, credit agencies, government agencies and research scholars.
(ii) Internal Analysis
Internal analysis is conducted by the management to know the financial position and operational efficiency of the organisation. The important feature of such analysis is that the management has access to all information of the enterprise and therefore, the analysis is more detailed extensive and accurate. Internal analysis is meant for management. External analysis is carried out by outsiders, such as creditors, bankers, debentureholders and government agencies.
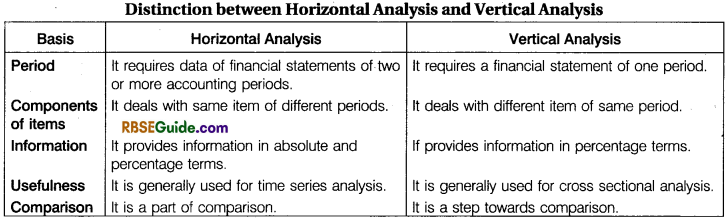
(iii) Horizontal (or Dynamic) Analysis
This analysis is made to review and analysis financial statements for a number of years. It is a time series analysis. It shows comparison of financial data for several years against a chosen base year. It is useful for long term trend analysis and planning. Comparative statements or comparative financial statements are an example of horizontal analysis.
(iv) Vertical (or Static) Analysis
This analysis is made to review and analyse financial statements of one year only. Ratio analysis of the financial statement relating to a particular accounting year is an example of this type of analysis. Such an analysis is useful in comparing the performance of several companies of the same type or divisions or departments in one enterprise.
![]()
Limitations of Financial Statement Analysis
Analysis of financial statements helps the interested parties in ascertaining the strengths and weakness of an enterprise, but at the same time it suffers from certain limitations. These limitations must always be kept in mind while undertaking the analysis of financial statements.
The limitations of financial statements analysis are :
1. Historical Analysis
Financial statement analysis is a historical analysis. It analyses what has happened till date. It does not reflect the future. Person like shareholders, investors etc. are more interested in knowing the likely position in future.
2. Ignore Price Level Changes
Price level changes and purchasing power of money are inversely related. A change in the price level makes analysis of financial statements of different accounting years invalid because accounting records ignore change in value of money.
3. Qualitative Aspect Ignored
Since the financial statements are confined to monetary matters alone, the qualitative aspects like quality of management, quality of staff, public relations are ignored while carrying out the analysis of financial statements,
4. Suffers from the Limitations of Financial Statements
Analysis of financial statements is based on the information given in the financial statements. Hence, this analysis suffers from all such limitations from which the financial statements suffer. Therefore, unless the basic data given in the financial statements is reliable the conclusions derived on the basis of the analysis of this data cannot be reliable.
5. Not Free from Bias
In many situations the accountant has to make a choice out of alternatives available e.g, choice in the method of inventory valuation or choice in the method of depreciation (straight line or written down value etc.) Since the subjectivity is inherent in personal judgement the financial statements are therefore not free from bias.
6. Variation in Accounting Practices
From inter firm comparison it is necessary the accounting practices followed by the firms do not very significantly. As there may be variations in accounting practices followed by different firms a meaningful comparison of their financial statements is not possible.
7. Window Dressing
Window dressing refers to the presentation of a better financial position that what it actually is by manipulating the books of account. On account of such a situation financial analysis may give false information to the users.
8. Identifies Symptoms
Financial analysis identifies symptoms of the problems but does not offer its diagnosis. The management has to look for the remedy to rectify the problems.
Parties Interested in Financial Statements
Society and nation are effected by the activities of every trading organisation. So, many people have interest in financial statement of organisation. The users of financial statements are divided into two parts:
![]()
Tools for Financial Analysis
Financial statements contain absolute figures of assets, liabilities, revenues, expenses and profit or loss of an enterprise. They do not reveal the earning capacity, liquidity and financial soundness of the enterprise. They are not readily understand able to their users. Hence, they are analysed to present them in simple and understandable form. Various tools or devices employed for analysing the financial statements are as follows :
Comparative statements :
- Common size statements
- Trend analysis
- Ratio analysis
- Cash flow statement
- Fund flow statement
- Break even point analysis
1. Comparative Financial Statements
In order to estimate the future progress of a firm. It is necessary to look into its past performance. For this purpose it becomes essential to make comparative study of its financial statements for two or more years.
When financial statements figures for two or more years are placed side-by-side to facilitate comparison these are called “Comparative Financial Statements.” Such statements not only show the absolute figures of various years but also provide for columns to indicate the increase or decrease in these figures from one year to another.
In addition these statements may also show the change from one year to another in percentage form. Such comparative statements are of great value in forming the opinion regarding the progress of the enterprise.
When financial statements of two or more years of the same firm are presented and compared, it is known as Inter Period Comparison or Intra Firm Comparison. When financial statements of two or more firms are compared cover a number of years, this is known as Inter Firm Comparison.
![]()
Advantages of Comparative Financial Statements
Data Presentation becomes Simple and Comparable: Comparative financial statement is a statement with data for two or more years in a tabular form. Thus, it is a simple presentation understandable and comparable. It helps in drawing conclusions easily.
Indicates Trend : Comparative financial statement gives information about the changes affecting financial position and performance of an enterprise. It is an indicator of trend and thus helps in forecasting.
Indicates Strengths and Weaknesses: Comparative financial statement indicates strengths and weaknesses of the enterprise with respect to liquidity, profitability and solvency.
Comparison with Other Firms and Industry Performance : Comparative financial statement helps in comparison of an enterprise’s performance with that of other enterprises or with that of the industry.
Forecasting and Planning: Analysing changes and trend in the financial data of previous years helps the management in forecasting and planning.
Key Financial Statistics : Comparative financial statements are a guide to understand the movements of key financial statistics.
Preparation of Comparative Balance Sheet
- A comparative balance sheet has six columns as follows :
- First Column : In this column the components or elements or items of balance sheet are written.
- Second Column: In this column the note number given against the line item in balance sheet is written.
- Third Column: In this column amount of previous year is written.
- Fourth Column: In this column amount of current year is written.
Fifth Column : In this column differences (increase or decrease) in amounts between the current year and the previous year are shown.
Sixth Column: In this column the difference of amount in column Vth (increase or decrease) is expressed as percentage, taking previous year, amount as the base.
![]()
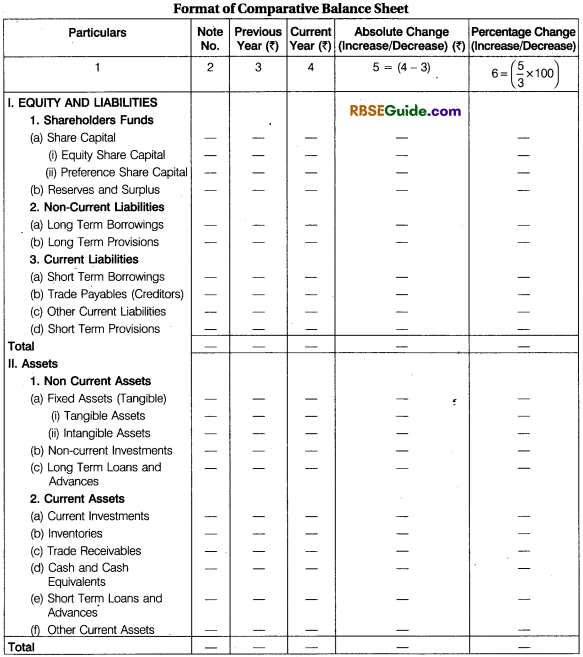
[Note: If current year’s figure has decreased show the absolute change and percentage change in brackets to reflect negative item.]
![]()
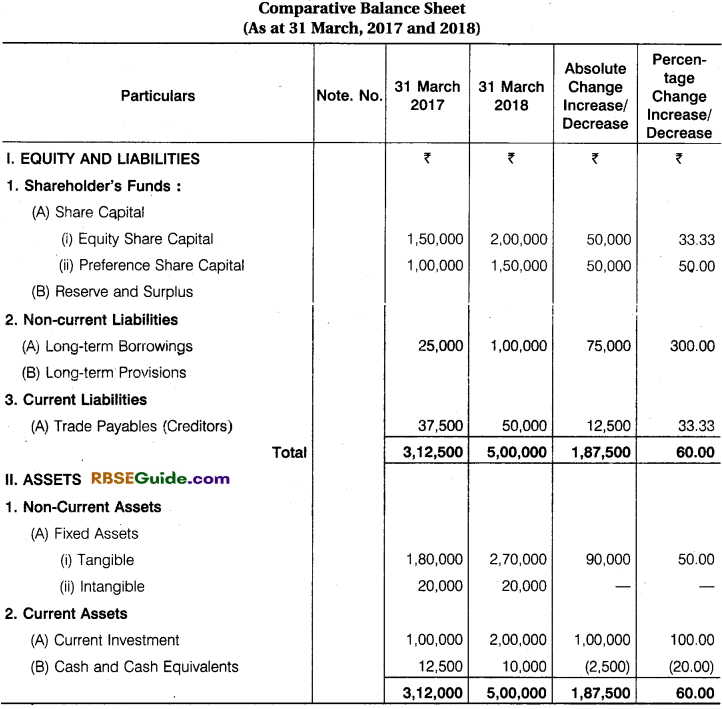
Illustration 1.
From the following balance sheet prepare comparative balance sheet of Mohan Limited.
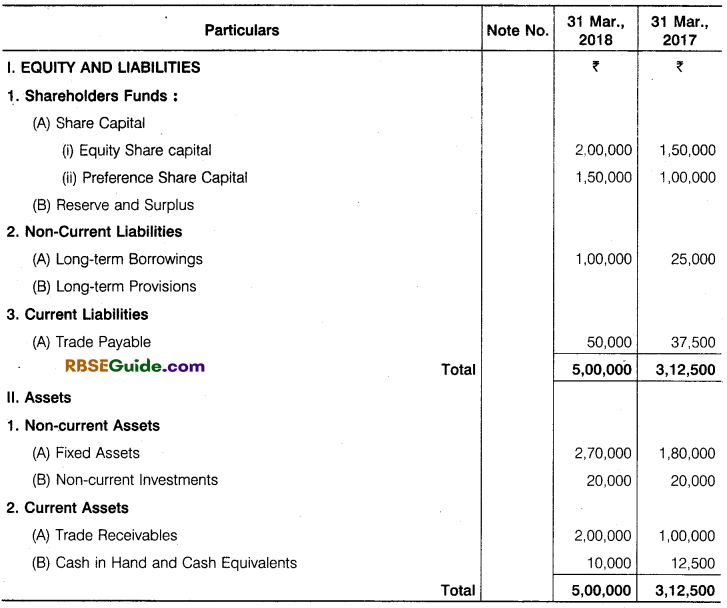
Solution:
![]()
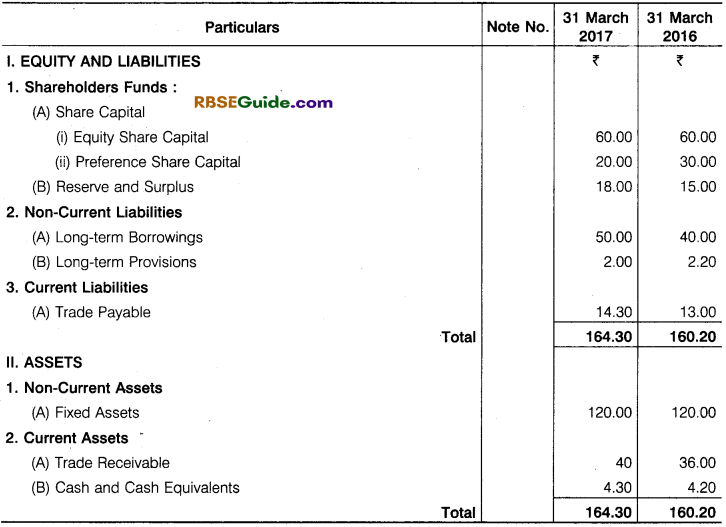
Illustration 2.
From the following balance sheet of X Ltd prepare comparative balance sheet:
(₹ in Lakhs)
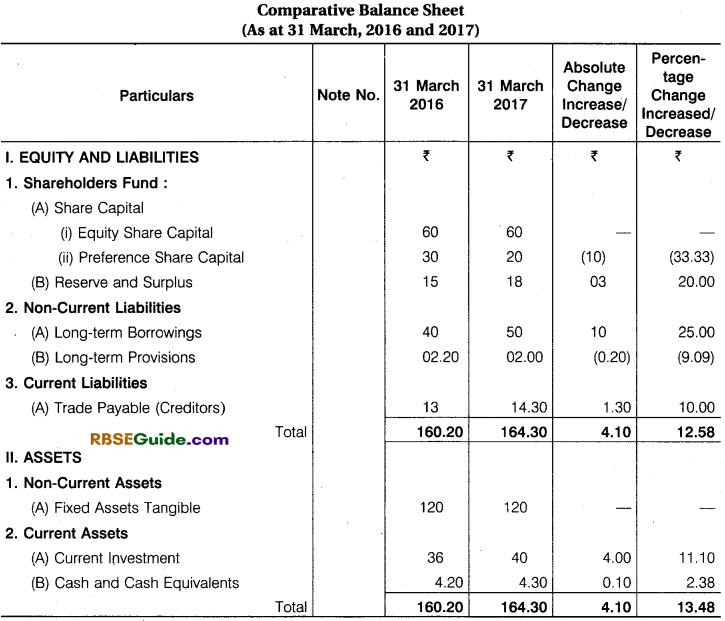
Solution:
Comparative Profit and Loss A/c or Income Statement
Statement of profit and loss or income statement shows profit earned or loss incurred during the year. Comparative profit and loss a/c (income statement) is the horizontal analysis of income statement which shows the operating results for more than one accounting period so that changes in absolute amount and percentage from one period to another.
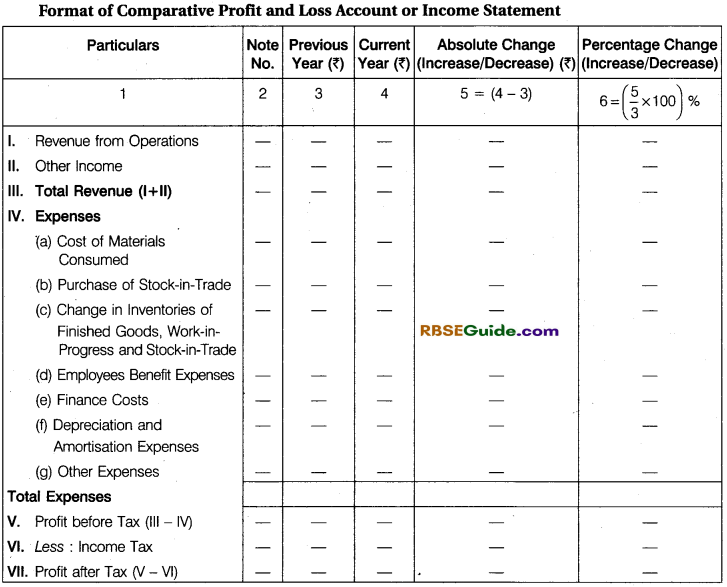
Preparation of Comparative Profit and Loss A/c (Income Statement)
Comparative Profit and Loss A/c (income statement) like comparative balance sheet is prepared having six columns as follows :
First Column : In this column the items of statement of profit and loss i.e., revenue and expenses are written. Revenue includes revenue from operations and other income, expenses i.e., cost of materials consumed, purchase of stock-in-trade, change in inventories of finished goods, WIP and stock-in-trade, employees benefit expenses, finance cost. Depreciation and amortisation expenses and other expenses are written.
Second Column : In this column, note number given against the item in the statement of profit and loss is written.
Third Column : In this column the amount of previous year is written.
Fourth Column : In this column the amount of current year is written.
Fifth Column : In this column differences (increase or decrease) in amount between the current accounting period and previous accounting period are recorded.
Sixth Column : In this column the above differences in column 5 (increase or decrease) expressed as a percentage of previous year’s amount are shown.
![]()
[Note: If current year’s figure has decreased show the absolute change and percentage change in brackets. So, as to reflect negative item.]
![]()
Illustration 3.
From the following information prepare comparative income statement of Krishna Ltd.
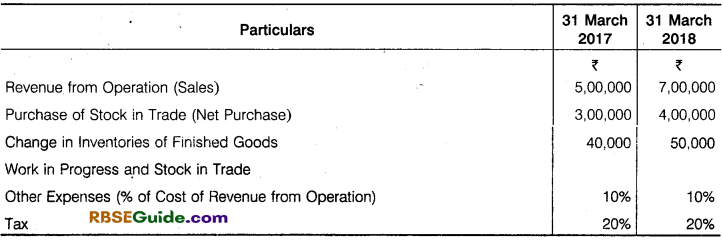
Solution:
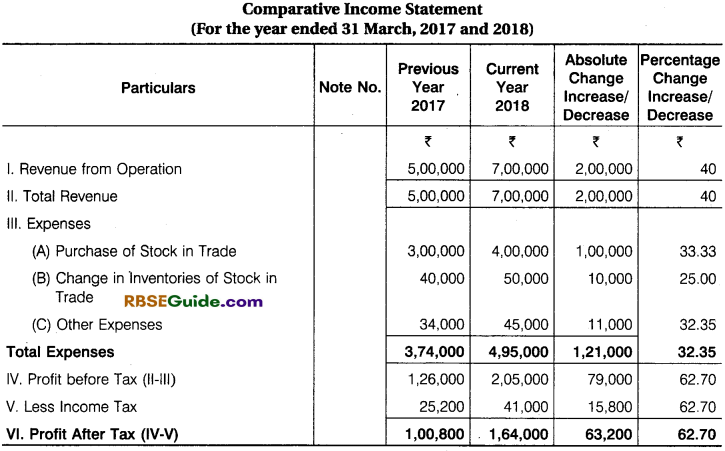
[Note: Cost of Revenue from Operation (Cost of Goods Sold = Purchase + Change in Inventories
So, Other expenses for 2016-17 will be 3,00,000 + 40,000 = 3,40,000 @ 10% = 34,000
Other expenses for 2017-18 will be 4,00,000 + 4,50,000 = 8,50,000 @ 10% = 85,000
![]()
Illustration 4.
From the following information extracted from profit and loss statement of X Ltd. prepare comparative income statement.
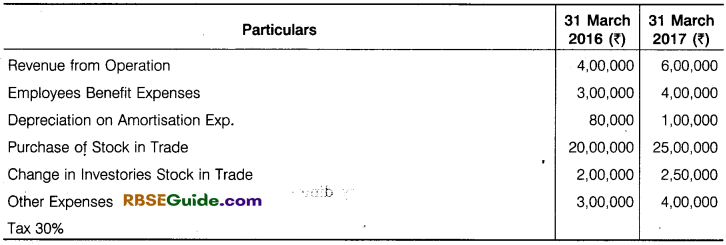
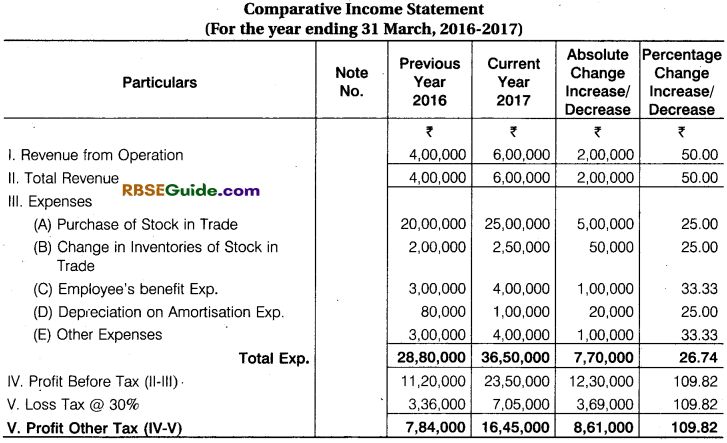
Solution:
Common Size Statements:
Common size financial statement is vertical analysis of financial statements in which amount of individual items of balance sheet or statement of profit and loss (or income statement) are written. These amount are further converted into percentage to a common base.
The common base is revenue from operations, i.e., net sales for statement of profit and loss and total of balance sheet for the balance sheet. The percentage so calculated can be compared with the corresponding percentage in other periods and meaningful conclusions can be drawn. Common size statements may be used for balance sheet as well as income statement.
[Note: This statement shows the relationship of various items with a common base which may be prepared for a year or two years or more.]
![]()
Meaning of Common Size Balance Sheet
A common size balance sheet is a statement in which total of assets or equity and liabilities is assumed to be equal to 100 and all the figures are expressed as percentage of the total. In other words, each asset is expressed as percentage to total assets and each item of equity and liability is expressed as percentage to total equity and liabilities.
Objectives of Common Size Balance Sheet
- To analyse change in individual items of balance sheet.
- To establish the trend in various items of assets and liabilities.
To judge the relative financial soundness for different enterprises belonging to the same industry by preparing their common size balance sheet for different periods.
To assess the financial strategy adopted by different enterprises belonging to the same industry.
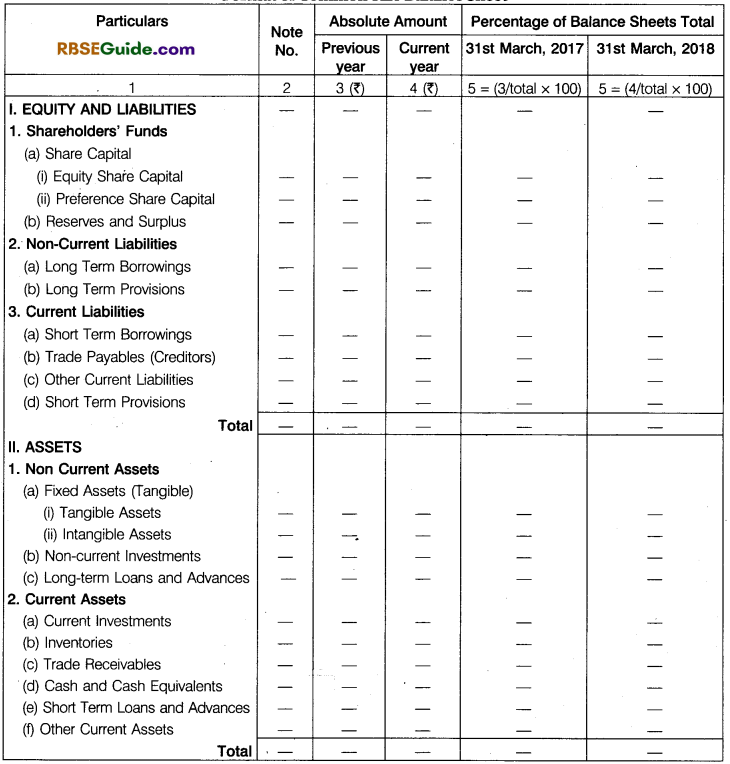
Preparation of Common Size Balance Sheet
Common size balance sheet is prepared by taking the following steps :
First Column: In this column items of balance sheet is written.
Second Column : In this column, note number given against the line item is written.
Third Column : In this column, amount of different items (assets/liabilities) of previous year are written.
Fourth Column : In this column, amount of different items (assets/liabilities) of current year are written.
Fifth Column: In this column percentage relation of different items of previous year’s balance sheet to total of equity and liabilities/total assets (taken as 100) are written.
Sixth Column: In this column, percentage relation of different items of current year’s balance sheet to total of equity and liabilities/total assets (taken as 100) are written.
![]()
Illustration 5.
From the following information, prepare Common Size Balance Sheet of Y Ltd.
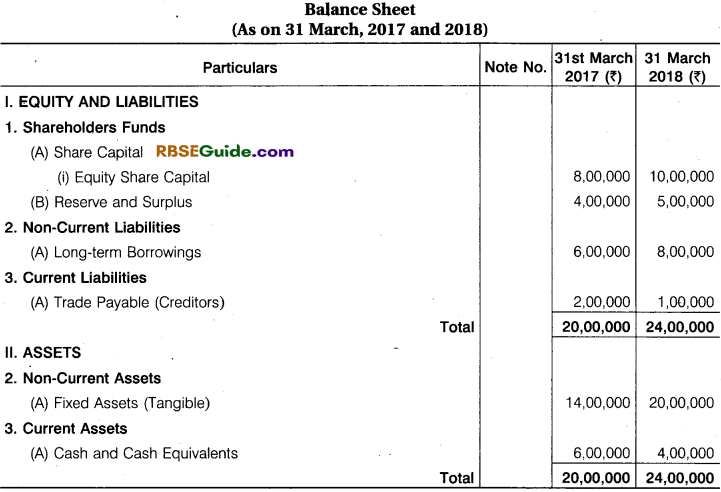
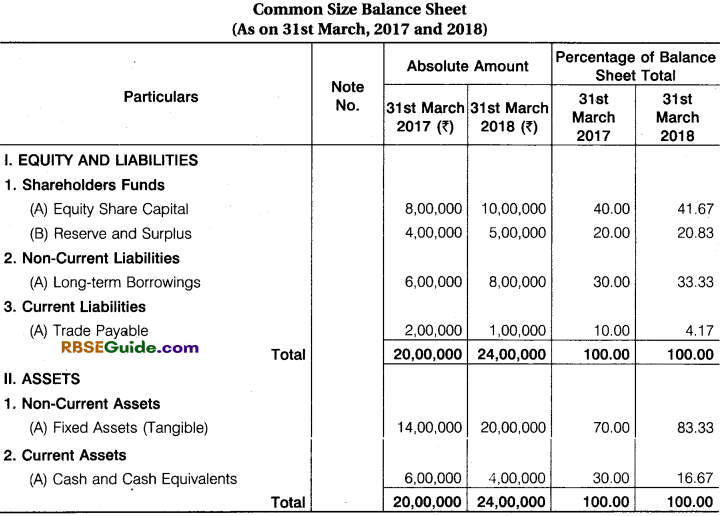
Solution:
![]()
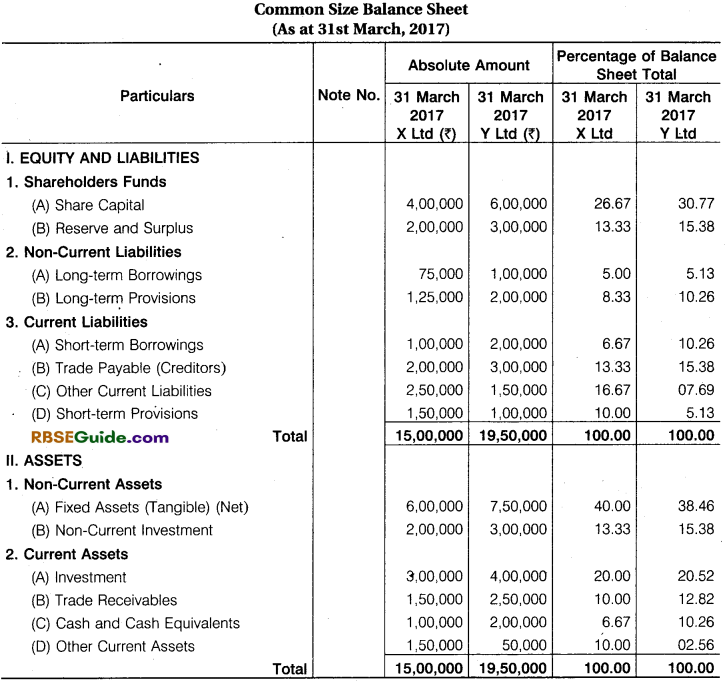
Illustration 6.
Prepare common size balance sheet of X and Y Ltd. from the following balance sheet:
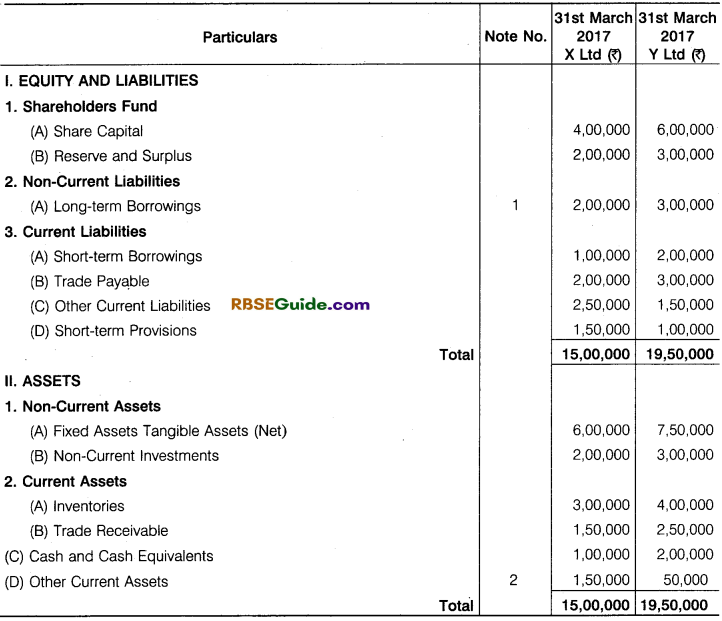
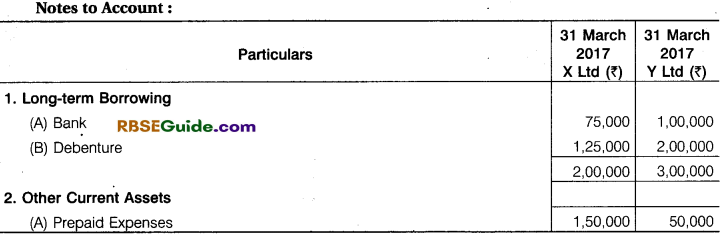
Solution:
Common Size Profit and Loss A/c (Income Statement)
In the common size Profit and Loss A/c, revenue from operations (net sales) is taken as 100 and expenses are expressed as percentage of revenue from operations (net sales). Common size statement of profit and loss may be prepared for different periods of the firm or for same period of two firms. It shows the relative efficiency in operating the business.
Objectives of Common Size Profit and Loss A/c (Income Statement)
- To establish a relationship between individual items of statement of profit and loss and revenue from operations.
- To analyse changes in individual items of statement of profit and loss in relationship to remove from operations.
- To judge the relative efficiency of cost items of the two or more firms belonging to the same industry.
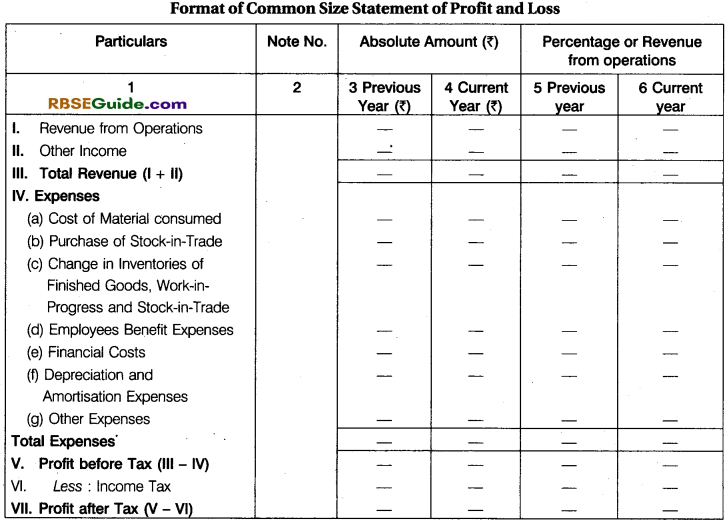
- Preparation of Common Size Statement of Profit and Loss (Income Statement)
![]()
Common size statement of profit and loss (income statement) is prepared having six columns as follows:
First Column : In this column the items of statement of profit and loss i.e., revenue and expenses are written. Revenue includes revenue from operations and other income, expenses i.e., cost of materials consumed, purchase of stock-in-trade, change in inventories of finished goods, WIP and stock-in-trade, employees benefit expenses, finance costs, depreciation and amortisation expenses and other expenses are written.
Second Column: In this column, note number given against the item in the statement of profit and loss is written.
Third Column: In this column, amount of previous year is written, if the statement is prepared for different period of the same firm. And if the statement is prepared for two firms amount relating to the firm is written.
Fourth Column: In this column amount of current year is written, if the statement is prepared for different period of the same firm. And if the statement is prepared for two firms amount relating to the firm is written.
Fifth Column: In this column percentage of different items of statement of profit and loss of the previous year to revenue from operations i.e., net sales (taken as 100) is written.
Sixth Column: In this column, percentage relation of different items of statement of profit and loss of the current year to revenue from operations i.e., net sales (taken as 100) is written.
![]()
Illustration 7.
Profit and Loss account for the year ending 31st March, 2017 and 2018 of Z Limited are given below. Prepare common size profit and loss account:
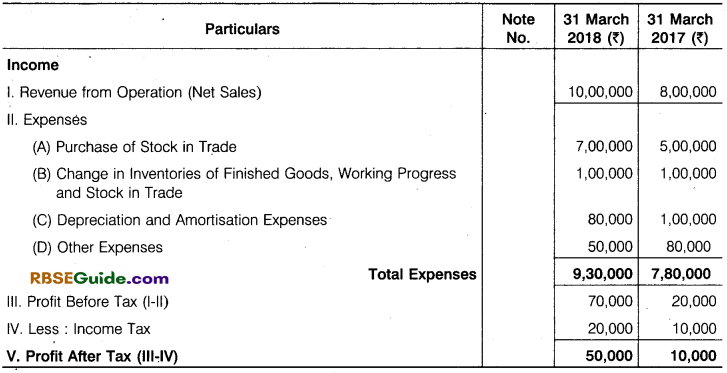
Solution:
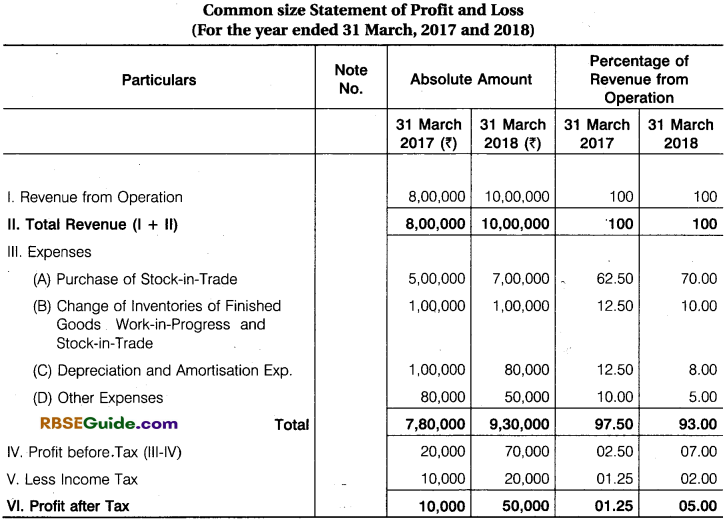
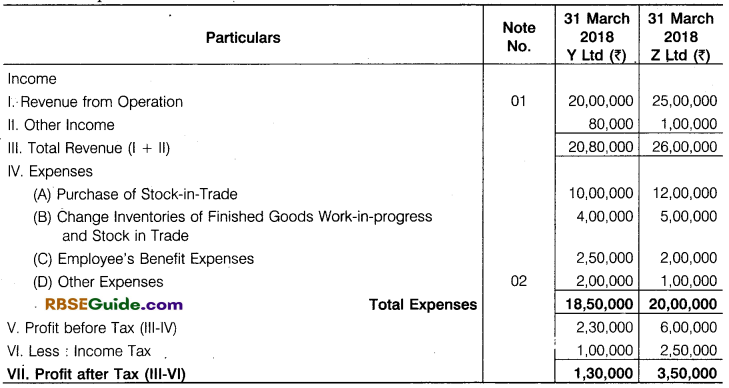
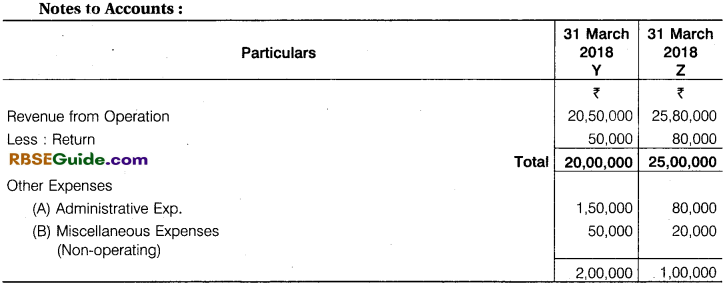
Illustration 8.
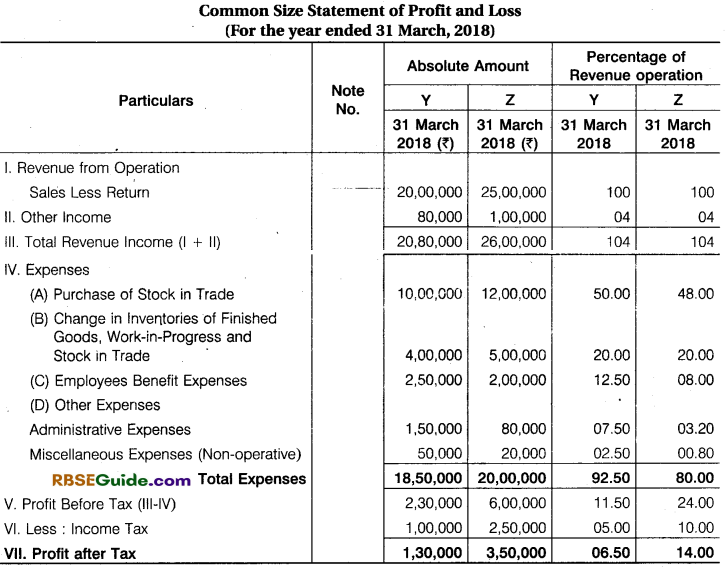
From the following statement of Profit and Loss of Y and Z Ltd. Prepare common size statement of profit and loss account.
Solution:
Trend Analysis
The financial statements may be analysed by computing trends of series of information. Trend analysis determines the direction upwards and downwards and involves the computation of the percentage relationship that each item bears to the same item in the base year.
In case of comparative statement an item is compared with itself in the previous year to know whether it has increased or decreased or remained constant. Common size is observed to know whether the proportion of an item (say cost of goods sold) is increasing or decreasing in the common base (say sales). But in case of trend analysis we learn about the behaviour of the same item over a given period, say, during the last 5 years.
![]()
Trend Percentage Analysis
Trend percentage are very useful in making comparative study of the financial statements for a number of years. These indicate the direction of movement over a long time and help an analyst of financial statements to form an opinion as to whether favourable or unfavourable tendencies have developed. This helps in future forecasts of various items.
For calculating trend percentage any year may be taken as the “base year”. Each item of base year is assumed to be equal to 100 and on that basis the percentage of each item of each year is calculated.
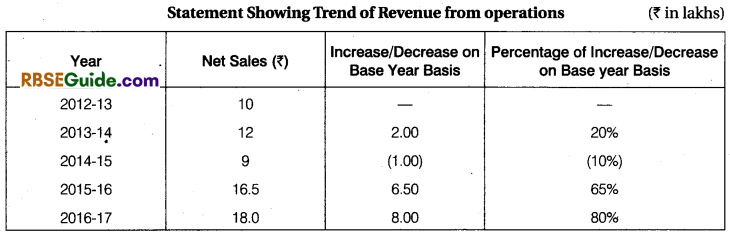
Trend Percentage of Increase/Decrease on Base Year Basis

Illustration 9.
Following are the informations of an enterprise with regard to revenue from operations. Taking base 2012-13, calculate Trend Percentage for measuring the changes.
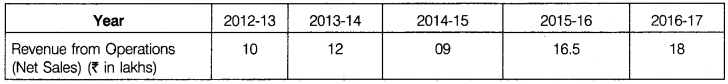
Solution:
Trend Ratio
The ratio of different items for various periods are find out and then compared under this analysis. The analysis of the ratio over a period of years given an idea of whether the business concern is trending upward or downward.
Whenever, the trend ratio are calculated for a business concern such ratios are compared with industry average.
![]()
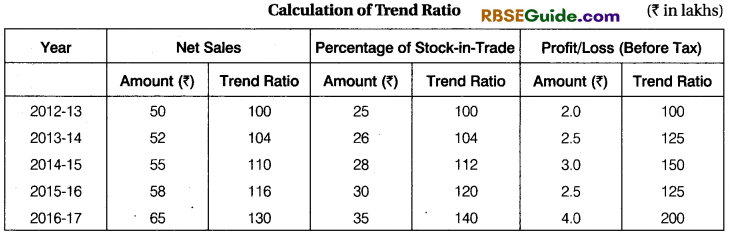
Illustration 10.
From the following information, calculate Trend Ratio taking base 2012-13 for the various items of Profit and Loss Account. (₹ in lakhs)
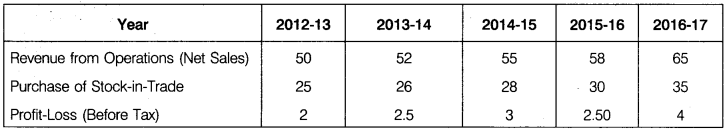
Solution:
Graphic or Diagrammatic Presentation
Graph provide visual representation of the performance. That can be easily compared over time. The graphs may be line graphs, colummgfdfihs or pie charts.
![]()
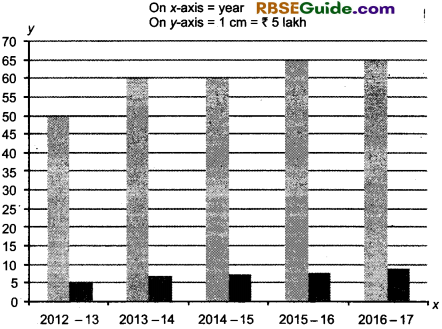
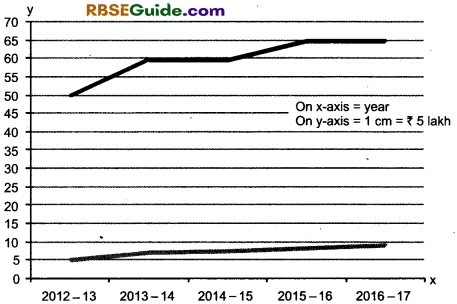
Illustration 11.
Present the following information of a company regarding equity share capital and profit after tax by preparing bar diagram and also through graph.
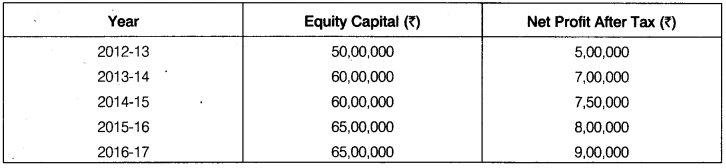
Solution:
Bar diagram shows company’s equity capital and profit after tax.
Limitations of Trend Analysis
Selection of Base Year: It is not easy to select the base year. Usually, a normal year is taken as the base year. But it is very difficult to select sucjya base year for the purpose of ascertaining the trend. Otherwise comparison or trend analysis will be of no value.
Consistency: It is also very difficult to follow a consistent accounting principle and policy particularly when the trends of business accounting are constantly changing.
Useless In Inflationary Situations : Analysis of trend percentage is useless at the time of price level change (i.e., in inflation). Trends of data which are taken for comparison will present a misleading result.
Analysis of Financial Statements Notes Important Terms
→ Financial Statements : These are the final accounts prepared at the end of the accounting period and include balance sheet and statement of profit and loss alongwith notes to accounts.
→ Comparative Statements : It is the statement prepared to compare individual items or components of the financial statements of two or more years of a company. The amount of each component of financial statement is placed side-by-side and difference is ascertained which is shown as a percentage of the base year.
→ Comparative Balance Sheet: It is the statement prepared to compare individual items or components of balance sheet of two or more years of a company.
→ Comparative Statement of Profit and Loss (Income Statement) : It is the statement prepared to compare individual items or components of statement of profit and loss (income statement) of two or more years of a company.
→ Common Size Statement : It is the statement prepared to compare components of financial statements (balance sheet and statement of profit and loss) of two years by converting them into percentage taking a common base.
→ Common Size Statement of Profit and Loss (Income Statement) : It is the statement prepared to compare components of statement of profit and loss of two years by converting them into percentage taking a common base i.e., revenue from operations.
→ Common Size Balance Sheet : It is the statement prepared to compare components of balance sheet of two years by converting them into percentage taking a common base i.e., total of assets or equity and liabilities.
→ Horizontal Analysis : This analysis is made to review and analysis financial statements for a number of years. It is a time series analysis. It shows comparison of financial data for several years against a chosen base year.
→ Vertical Analysis : Correlation between sundry factors and their total in financial statement called vertical analysis. This analysis is made to review and analyse financial statements of one year only.
→ Interfirm Comparison : A study or analysis of specific or a period of financial statement of two or more firm is called interfirm comparison.