
Make use of our RBSE Class 12 Accountancy Notes here to secure higher marks in exams.
Rajasthan Board RBSE Class 12 Accountancy Notes Chapter 11 Ratio Analysis
Ratio analysis is a technique of financial statements analysis. It is the most widely used tool to interpret quantitative relationship between two variables of the financial statements.
Meaning of Ratio and Accounting Ratio
Ratio is an arithmetical expression of relationship between two inter-dependent or related items. Ratios when calculated on the basis of accounting ratios. Accounting ratio may be expressed as an arithmetical relationship between two accounting variables.
“The term accounting ratio is used to describe significant relationships which exist between figures shown in a balance sheet in a statement of profit and loss,in a budgetary control system or in any part of the accounting organisations”. – J. Betty
“A ratio is simply one number expressed in terms of another. It is found by dividing one number into the other.” – R.N. Anthony
Expression of Ratio
Accounting ratio can be expressed in any of the following forms :
1. Pure Ratio : It is expressed as quotient. For example, current ratio which expresses the relationship between current assets and current liabilities is (say) 2.
![]()
Alternatively, it may also be expressed as 2 : 1.
2. Percentage : It is expressed in percentage. For example, net profit ratio which relates net profit to revenue from operations, i.e., net sales.

3. Times : It is expressed in number of times a particular figure is when compared to another figure. For example, trade payables or creditors turnover ratio, which shows relationship between net credit purchase and average payables is (say) 4 times.
4. Fraction: It is expressed in fraction. For example, ratio of fixed assets to share capital is (say)
\(\frac { 3 }{ 4 } \) {i.e., 0.75).
Ratio, sometimes may be expressed in terms of days also. For example, average collection period is 73 days.
![]()
Meaning of Ratio Analysis
- “Ratio analysis is a study of relationship among various financial factors in a business.” – Myers
- Ratio analysis is a process of determining and interpreting relationship between the items of financial statements to provide a meaningful understanding of the performance and financial position of a enterprise.
- Thus, it is a technique of analysing the financial statements by computing ratio.
Objectives (or Advantages) of Ratio Analysis
Ratio analysis serves the purpose of various users who or interested in the financial statements. It simplifies, summaries and systematises the figures in the financial statements. The objectives of ratio analysis can be better understood from the following advantages of ratio analysis :
(1) Useful in Analysis of Financial Statements: Ratio analysis is an extremely useful device for analysing the financial statements. It help the bankers, creditors, investors, shareholders etc. in acquiring enough knowledge about the profitability and financial condition of the business. In the light of the knowledge so acquired by them, they can take necessary decisions about their relationships with the concern.
(2) Simplification of Accounting Data: Accounting ratio simplifies and summaries a long array of accounting data and makes them understandable. It discloses the relationship between two such figures which have a cause and effect relationship with each other.
(3) Helpful in Comparative Study: With the help of ratio analysis comparison of profitability and financial soundness can be made between one firm and another in the same industry. Similarly, comparison of current year figures can also be made with those of previous years with the help of ratio analysis.
(4) Helpful in Locating the Weak Spots of the Business : Current year’s ratios are compared with those of the previous years and if some weak spots are thus, located remedial measures are taken to correct them.
(5) Helpful in Forecasting: Accounting ratios are very helpful in forecasting and preparing the plans for the future. For example, if sales of a firm during this year are ₹ 10 lakhs and average amount of etock kept during the year was ₹2 lakhs i.e., 20% of sales and if the firm wishes to increase sales next year to ₹ 15 lakhs, it must be ready to keep a stock of ₹ 3,00,000 i.e., 20% of 15 lakhs. Similar the other estimates for future can be worked out by establishing a relationship between capital and sales debtors and sales expenses and sales etc.
(6) Estimate About the Trend of the Business: If accounting ratios are prepared for a number of years they will reveal the trend of costs, sales, profits and other important facts.
(7) Fixation of Ideal Standards : Ratio helps us in establishing ideal standards of the different items of the business. By comparing the actual ratios calculated at the end of the year with the ideal ratios, the efficiency of the business can bq easily measured.
(8) Effective Control: Ratio analysis discloses the liquidity, solvency and profitability of the business enterprise. Such information enables management to assess the changes that have taken place over a period of time in the financial activities of the business. It helps them in discharging their managerial functions e.g., planning, organising, directing, communicating and controlling more effectively.
![]()
Limitations of Accounting Ratios
These limitations should be kept in mind while making use of accounting ratio :
(1) False Accounting Data Gives False Ratio : Accounting ratios are calculated on the basis of data given in profit and loss account and balance sheet. Therefore they will be only as correct as the accounting data on which they are based. For example, if the closing stock is over valued not only the profitability will be overstated but also the financial position will appear to be better.
Therefore unless the profit and loss account and balance sheet are reliable the ratios based on them will not be reliable. There are certain limitations of financial statements as discussed in the previous chapter, as such the ratios calculated on the basis of such financial statements will also have the same limitations.
(2) Comparison Not Possible if Different Firms Adopt Different Accounting Policies: There may be different accounting policies adopted by different firms with regard to providing depreciation, creation of provision for doubtful debts, methods of valuation of closing stock etc. For instance, one firm may adopt the policy of charging depreciation on straight line basis while other may charge on written down value method. Such differences make the accounting ratios incomparable.
(3) Ratio Analysis Becomes Less Effective Due to price Level Changes : Price level over the years goes on changing therefore the ratios of various years cannot be compared. For example, one firm sells 1,000 machines for ₹ 10 lakhs during 2017, it again sells 1,000 machines of the same type in 2018 but owing to rising prices the sales price was ₹ 15 lakhs. On the basis of ratios it will be concluded that the sales have increased by 50% whereas in actual, sales have not increased at all. Hence the figures of the past years must be adjusted in the light of price level changes before the ratios for these years are compared.
(4) Limited Use of a Single Ratio : The analyst should not merely rely on a single ratio. He should study several connected ratios before reading a conclusion. For example, the current ratio of a firm may be quite satisfactory whereas the quick ratio may be unsatisfactory.
(5) Lack of Proper Standards: Circumstances differ from firm to firm hence no single standard ratio can be fixed for all the firms against which the actual ratio may be compared. For example, the current ratio of 2:1 is generally accepted as an ideal ratio which means that the current assets should be adeast twice in comparison to the current liabilities. But if a firm has such type of arrangement with its bankers that the bankers will provide necessary credit to the firm in case of need the ideal current ratio for such a firm may be less than 2:1.
(6) Ignores Qualitative Factors : Ratio analysis is a quantitative measurement of the performance of the business. It ignores qualitative factors which are also essential for interpretation. For example, credit maybe granted to a customer on the basis of certain ratios of his business but the character and managerial ability of the customer must also be taken into consideration.
(7) Ratio Alone are Not Adequate for Proper Conclusions : Ratio derived from analysis of statements are not sure indicators of good or bad financial position and profitability of a firm. They merely indicate the probability of favourable or unfavourable position. The analyst has to carry out further investigations and exercise his judgement in arriving at a correct diagnosis. This is for this financial analysis in addition to the tolls of ratio analysis.
(8) Effect of Personal Ability and Bias of the Analyst: Another important point to keep in mind is that different persons draw different meaning of different terms. One analyst may calculate ratios on the basis of profit after interest and tax, whereas another analyst may consider profits before interest and tax, a third may consider profits after interest but before tax.
Therefore, before making comparisons one must be sure that the ratios have been calculated on the same basis.
Although ratio analysis suffers from a number of limitations as enumerated above, yet it is a very useful and widely used tool of analysing the financial statements. Useful conclusions may be arrived at by ratio analysis provided the above mentioned limitations are kept in mind while using the results obtained from ratio analysis.
![]()
Functional Ratio may be classified into the five categories as follows:
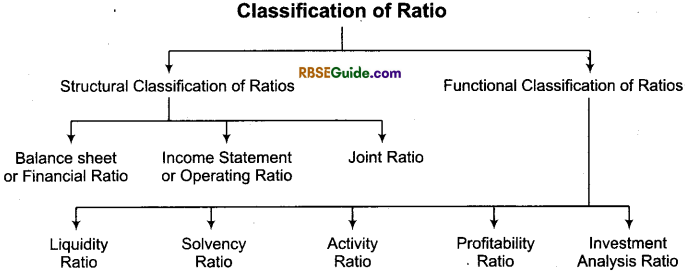
1. Liquidity Ratios
“Liquidity” refers to the ability of the firm to meet its current liabilities. The liquidity ratios therefore, are also called Short Term Solvency Ratios. These ratios are used to assess the short term financial position of the concern. They indicate the firm’s ability to meet its current obligations out of current sources. In the words of Saloman J. Flink, “Liquidity is the ability of the firm to meet its current obligations as they fall due”.
In the words of Herbert B. Mayo, “Liquidity is the ease with which assets may be converted into cash without loss.”
Short term creditors of the firm are primarily interested in the liquidity ratios of the firm as they want to know how promptly or readily the firm can meet its current liabilities. If the firm wants to take a short term loan from the bank, the bankers also study the liability ratios of the firm in order to assess the margin between current assets and current liabilities.
Liquidity ratios include two ratios:
- Current ratio or working capital ratio
- Quick ratio or acid test ratio or liquid ratio.
2. Solvency Ratios
These ratios are calculated to assess the ability of the firm to meet its long term liabilities as and when they become due. These ratios reveal as to how much amount in a business has been invested by proprietors and how much amount has been raised from outside sources. Solvency ratios disclose the firm ability to meet the interest costs regularly and long term indebtedness at maturity. Some important solvency ratios are :
- Debt equity ratio
- Total assets to debts ratio
- Proprietory ratio
- Interest coverage ratio.
3. Activity Ratios
These ratios are calculated on the basis of cost of sales or sales therefore, these ratios are also called as Turnover Ratios. Turnover indicates the speed or number of times the capital employed has been rotated in the process of doing business. In other words, these ratios indicate how efficiently the working capital and stock is being used to obtain sales. Higher turnover ratios indicate the better use of capital or resources and in turn lead to higher profitability.
Some important turnover ratios are:
- Inventory turnover ratio or stock turnover ratio
- Debtors or receivables turnover ratio
- Creditors or payables turnover ratio
- Working capital turnover ratio.
4. Profitability Ratios or Income Ratios
The main object of all the business concerns is to earn profit. Profit is the measurement of the efficiency of the business. Profitability ratios measure the various aspects of the profitability of a company, such as :
- What is the rate of profit on sales ?
- Whether the profits are increasing or decreasing and if decreasing the cause of their decrease ?
Some important profitability ratios are:
- Gross profit ratio
- Operating ratio
- Operating profit ratio
- Net profit ratio
- Return on investment or R.O.I.
5. Investment Analysis Ratios
These ratios helpfull in analysis of future investment in company by a shareholder. Some important investment Analysis Ratio are :
- Earning per share
- Dividend per share
- Divident payout ratio.
1. Liquidity Ratios : Liquidity ratios are those ratios which are computed to evaluate the capability of the entity to meet its short term liabilities. Commonly used liquidity ratios are:
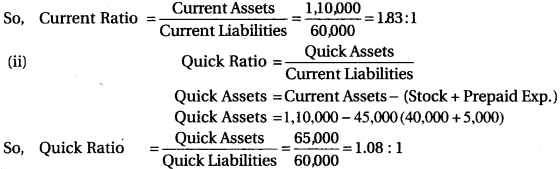
(i) Current Ratio or Working Capital Ratio :
Current ratio is a liquidity ratio that measures ability of the enterprise to pay its short term financial obligations i.e., liabilities. It is a relationship of current assets and current liabilities. Current ratio indicates whether the enterprise will be able to meet its short term financial obligations when they become due for payment. Thus, current ratio is a measurement of financial health of the enterprise.
Computation: The formula for calculating the ratio is :
![]()
“Current assets” include those assets which can be converted into cash within in year’s time and “Current liabilities” include those liabilities which are repayable in a year’s time.
Current Assets : Cash in Hand + Cash at Bank + B/R + Short Term Investments (Marketable Securities) + Debtors (Debtors – Provision) + Stock (Stock of Finished Goods + Stock of Raw Material + Work in progress + Prepaid Expenses
Current Liabilities : Bank Overdraft + B/P + Creditors + Provision for Taxation + Proposed Dividends + Unclaimed Dividends + Outstanding Expenses + Loans Payable within a Year
Objective and Significance: The objective of calculating current ratio is to assess the ability of the enterprise to meet its short term financial obligations i.e., liabilities. It is a ratio computed to assess short term solvency of the enterprise as on the date when current ratio is computed. It shows the number of times current assets are in excess of the current liabilities.
It should be noted that the help of current ratio, amount of current assets and current liabilities can also be calculated the amount of working capital is given.
Working Capital: Working capital means excess of current assets over current liabilities i.e., Working Capital = Current Assets – Current Liabilities
![]()
Illustration 1.
From the following calculate Current ratio : Total Assets ₹ 4,00,000, Non-current assets, ₹ 2,20,000, Shareholder’s Fund ₹ 2,50,000, Non-current liabilities 160,000.
Solution:
![]()
Current Assets = Total Assets – Non-current Assets
Current Assets = 4,00,000 – 2,20,000 = ₹ 1,80,000
Current Liabilities = Total Assets – Shareholders Fund – Non-current Liabilities
Current Liabilities = 4,00,000 – 2,50,000 – 60,000
Current Liabilities = ₹ 90,000
Current Ratio = \(\frac { 1,80,000 }{ 90,000 } \) = \(\frac { 2 }{ 1 } \) = 2 : 1
Current Ratio = 2 : 1
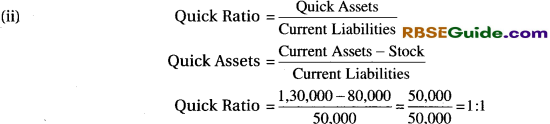
(ii) Liquid Ratio or Quick Ratio or Acid Test Ratio : Liquid ratio or quick ratio or acid test ratio is a liquidity ratio which measures the ability of the enterprise to meet its short term financial obligations i.e., liabilities. It is a relationship of liquid assets with current liabilities.
Computation: The ratio is calculated as follows :
![]()
Liquid or quick assets are the assets which are either in the form of cash and cash equivalents or can be converted into cash within a very short period i.e., are the most liquid assets.
Thus it excludes inventories and prepaid expenses. Inventories are excluded from liquid assets because it takes time before it can be converted into cash and cash equivalents.
Prepaid expenses are excluded from it because these are expenses paid in advance, hence, cannot be converted into cash and cash equivalents.
Quick ratio of 1 : 1 is an accepted standard, since for every rupee of current liabilities there is a rupee of quick assets.
In case, liquid ratio is less than 1, it means that current liabilities are more than its liquid or quick assets. As a result the enterprise may not be able to meet its short term financial obligations i.e., current liabilities, if they fall due for payment on that date.
Objective and Significance : The objective of computing liquid ratio/quick ratio is to assess whether the enterprise would be able to meet its short term financial obligations i.e., liabilities, if they arise on the date when liquid ratio is computed.
A part of the current assets is not readily realisable or convertible into cash. Therefore, the current ratio does not indicate adequately the ability of the enterprise to meet its current liabilities as and when they fall due.
Liquid ratio is an indicator of short term debt paying capacity of an enterprise and thus, it is a better indicator of liquidity. This ratio is very important for banks and financial institutions. The comparison of current ratio with liquid ratio would indicate the degree of inventory held. A high liquid ratio compared to current ratio may indicate understocking while a low liquid ratio indicates overstocking.
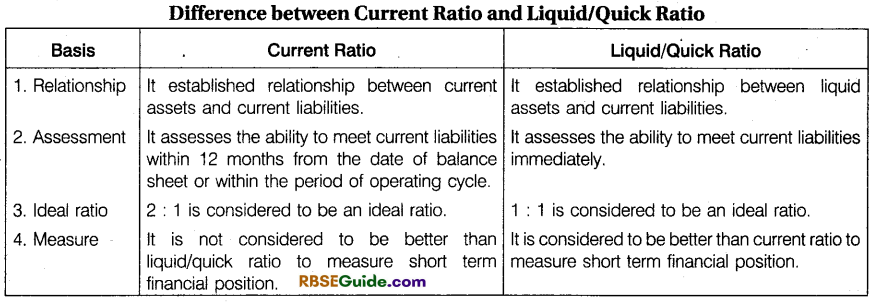
Difference between Current Ratio and Liquid/Quick Ratio
![]()
Illustration 2.
Following the Balance Sheet of Ashoka Ltd on 31st March 2018:
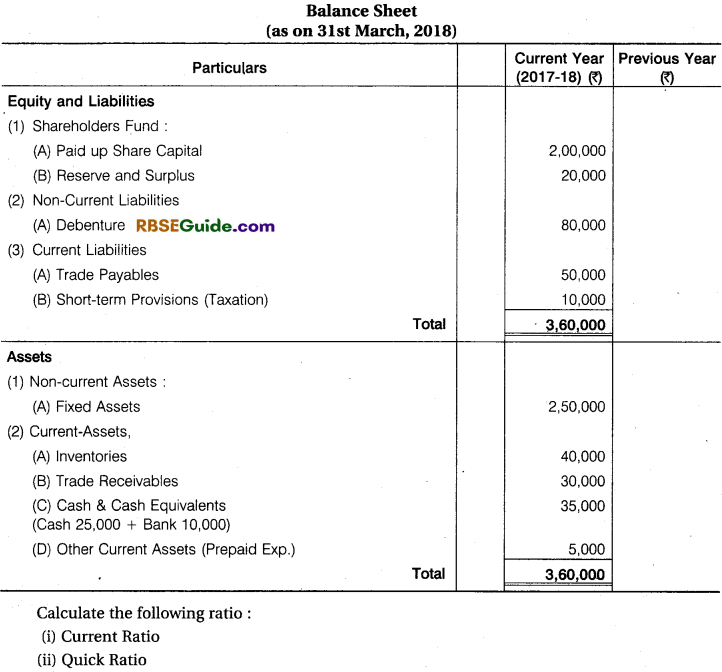
Solution:
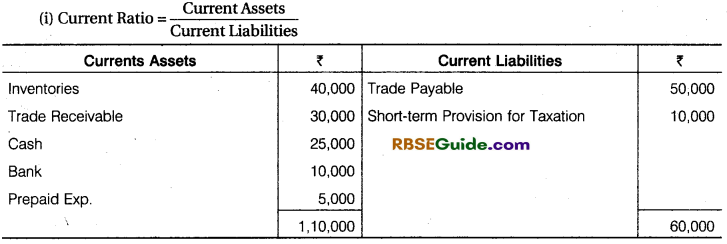
![]()
Illustration 3.
Following is the Balance Sheet of Rakesh Limited as on 31 March 2018:
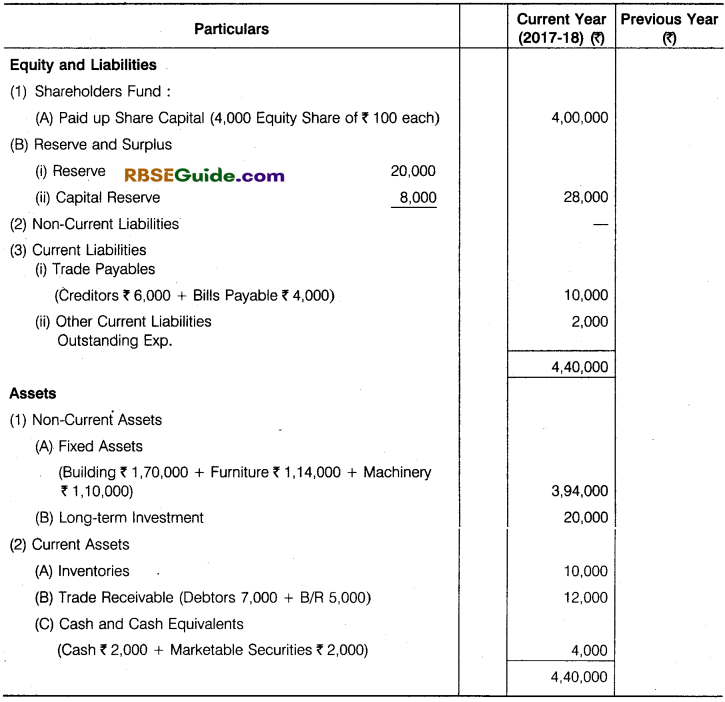
Calculate the following ratio:
- Current Ratio
- Quick Ratio
Solution:
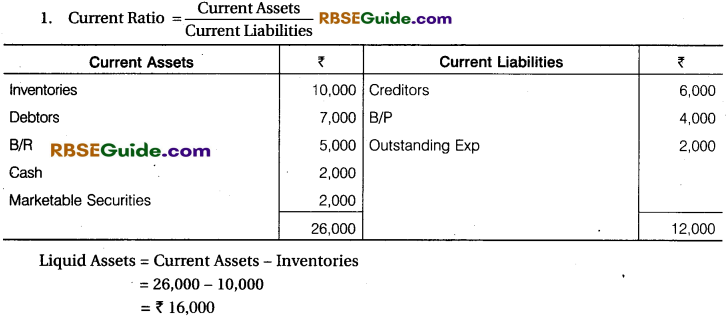
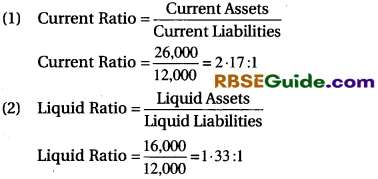
![]()
Illustration 4.
From the following figures calculate the current
Solution:
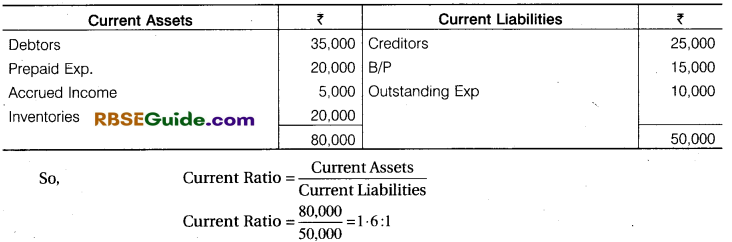
Illustration 5.
Current Assets and Current Liabilities of Preete Limited were as on 31 March, 2018, 80,000 and 40,000.
Solution:
Calculate Current Ratio:

So, it is a ideal ratio.
2. Solvency Ratios
(i) Debt Equity Ratio : This ratio expresses the relationship between long term debts and shareholders’ funds. It indicates the proportion of funds which are acquired by long term borrowings in comparison to shareholders’ funds. This ratio is calculated to ascertain the long term financial policies of the firm

Long Term Loans : These refer to long term liabilities which mature after one year. These include debentures, mortgage loan, bank loan, loan from financial institutions and public deposits etc.
Shareholders’ Funds : These include equity share capital, preference share capital, securities premium, general reserve, capital reserve, other reserves and credit balance of profit and loss account. However, accumulated losses and fictitious assets remaining to be written off like preliminary expenses, underwriting commission, share issue expenses etc. should be deducted.
Significance : This ratio is calculated to assess the ability of the firm to meet its long term liabilities. Generally, debt equity ratio of 2 :1 is considered safe. If the debt equity ratio is more than that, it shows a rather risky financial position from the long term point of view as it indicates that more and more funds invested in the business are provided by long term lenders.
A high debt equity ratio is a danger signal for long term lenders. The lower this ratio the better it is for long term lenders because they are more secure in that case. Lower than 2 : 1 debt equity ratio provides sufficient protection to long term lenders.
(ii) Proprietory Ratio : This ratio indicates the proportion of total assets funded by owners or shareholders. It is calculated as under
![]()
Significance : A higher proprietory ratio is generally treated an indicator of sound financial position from long term point of view because it means that a large proportion of total assets is provided by equity and hence the firm is less dependent on external sources of finance.
On the contrary, a low proprietory ratio is a danger signal for long term lenders as it indicates a lower margin of safety available to them. The lower the ratio, the less secured are the long term loans and they face the risk of losing their money.
(iii) Solvency Ratio: Solvency ratio shows relationship between long term debts and total assets of the enterprise.
Computation : The ratio is computed as follows :
![]()
Total Debts : Debentures + Bonds + Mortagage home + Bank Loan + Loan from financial Institutions + Public Deposits + Long term Provisons. + ST Loans + Trade Payables + ST Provisions.
Total Assets : It includes Non-Current Assets [Fixed Assets (Tangible and Intangible Assets) + Non-Current Investments + Long Term Loans and Advances] + Current Assets [Current Investments + Inventories (including Spare Parts and Loose Tools) + Trade Receivables + Cash and Cash Equivalents + Short Term Loans and Advances + Other Current Assets]
Objective and Significance : The objective of computing the ratio is to establish relationship between total long term debts and total assets of the enterprise. It measures the safety margin available to the lenders of the long term debts. In other words, it measures the extent to which debt (long term) is covered by the assets.
A high ratio means higher safety for lenders of the business. On the other hand, a low ratio means lower safety for lenders as the business depends largely on outside loans for its existence. In other words, investment by the proprietor is low.
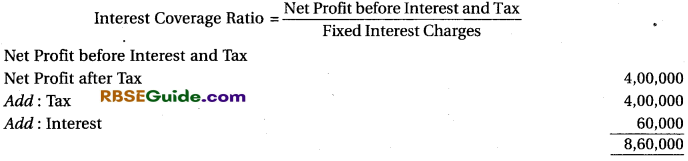
(iv) Interest Coverage Ratio : This ratio is also termed as “Debt Service Ratio.” This ratio is calculated by dividing the net profit before charging interest and income tax by fixed interest charges.
![]()
Net profit before interest and income tax to be taken for the calculation of this ratio because this is the amount of profit out of which interest and income tax is to be paid out. Fixed interest charges include interest on fixed (long term) loans or debentures.
Significance : This ratio indicates how many times the interest charges are covered by the profits available to pay interest charges. A long term lender is interested in finding out whether the business will earn sufficient profits to pay the interest charges regularly. This ratio measures the margin of safety for long term lenders.
The higher the ratio, more secure the lender is in respect of payment of interest regularly. If profit just equals interest, it is an unsafe position for the lender as well as for the company also, as nothing with be left for shareholders.
obligations.
![]()
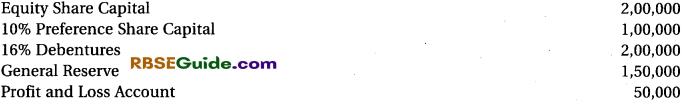
Illustration 6.
From the following particulars calculate Debt Equity Ratio:
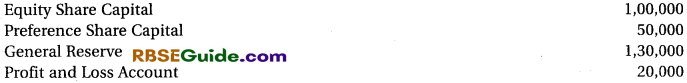
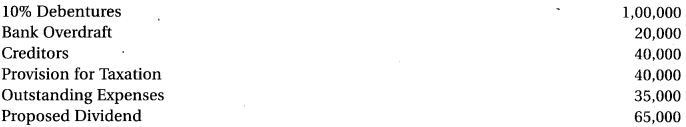
Solution:

Total Debts = Debenture + Bank Overdraft + Creditors + Provision for Taxation + Outstanding Exp. + Proposed Dividend = 1,00,000 + 20,000 + 40,000 + 40,000 + 35,000 + 65,000 = ₹ 3,00,000
Shareholders Fund = Equity Share Capital + Preference Share Capital + General Reserve + P & L A/c
= 1,00,000 + 50,000 + 1,30,000 + 20,000 = ₹ 3,00,000
![]()
Illustration 7.
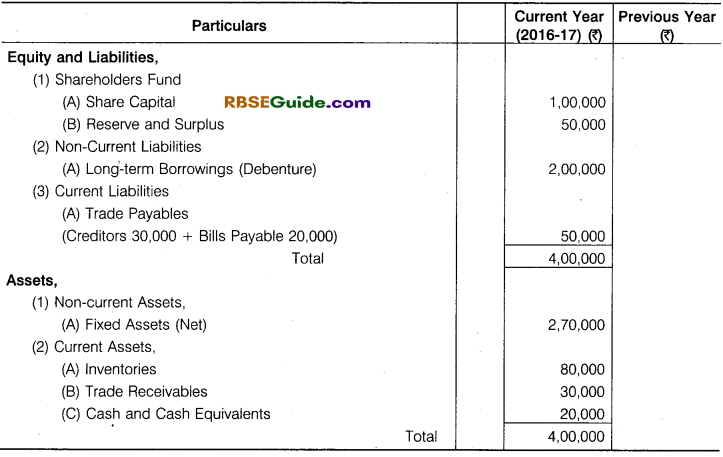
From the following statement, calculate:
- Current Ratio
- Quick Ratio
- Debt Equity Ratio
- Solvency Ratio.
Solution:
Solution:
![]()
Current Assets = Cash +Debtors + Stock
20,000 + 30,000 + 80, 000 = ₹ 1, 30, 000
Current Liabilities = Creditors + Bills Payable
= 30, 000 + 20,000 = ₹ 50,000
![]()
Outsider Liabilities = Debenture + Creditors + B/P
20,000 + 30,000 + 20,000 = ₹ 2,50,000
Shareholders Fund = Share Capital + Reserve and Surplus
= 1,00,000 + 50,000 = ₹ 1,50,000
![]()
Illustration 8.
Calculate proprietory ratio from the following information:
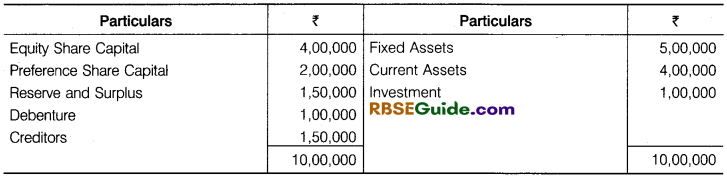
Solution:
(i) Proprietory Ration
![]()
\(\frac { 4,00,000+2,00,000+1,50,000 }{ 10,00,000 } \) = \(\frac { 7,50,000 }{ 10,00,000 } \) = 0.75 : 1
(ii) Fixed Assets to Proprietory Fund Ratio =
![]()
= \(\frac { 6,00,000 }{ 7,50,000 } \) = 0.8 : 1
(Investment are treated as fixed assets )
(iii) Total Current Assets to proprietory Fund Ratio =
![]()
= \(\frac { 4,00,000 }{ 7,50,000 } \) = 0.53 : 1
![]()
Illustration 9.
From the following particulars calculate the capital gearing ratio
Solution:
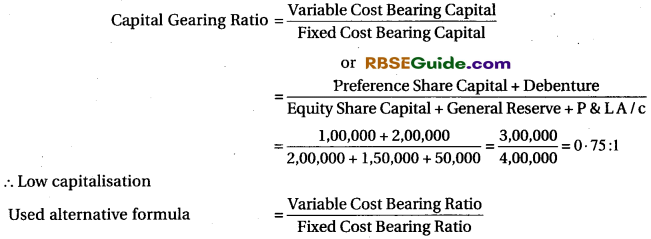
Capital Gearing Ratio = \(\frac { 4,00,000 }{ 3,00,000 } \) = 1 . 33 : 1
Here this ratio is higher than 01, so its indicate Low capitalisation.
![]()
Illustration 10.
From the following Balance Sheet calculate Debts Equity Ratio, Capital Gearing Ratio and Liquidity Ratio.
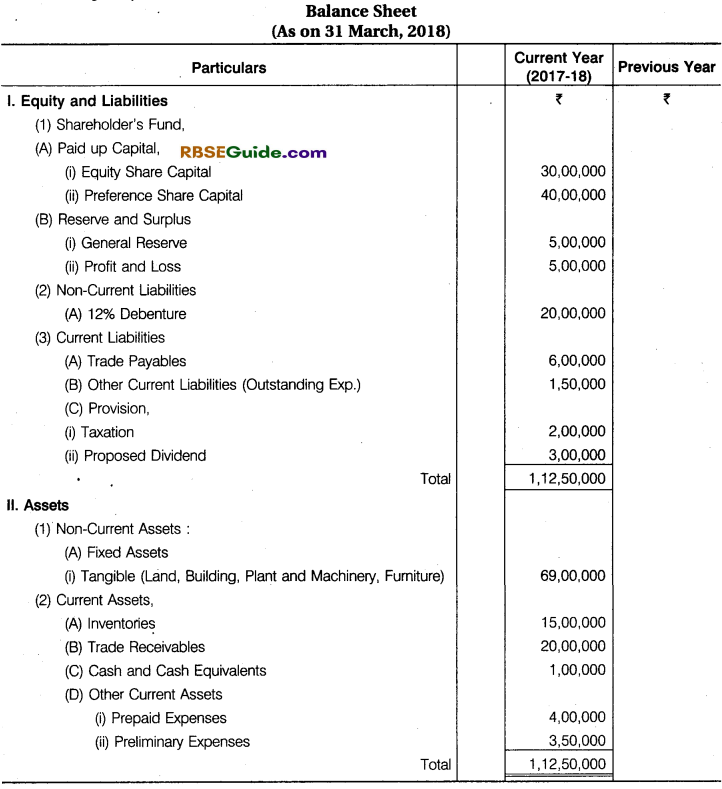
Solution:
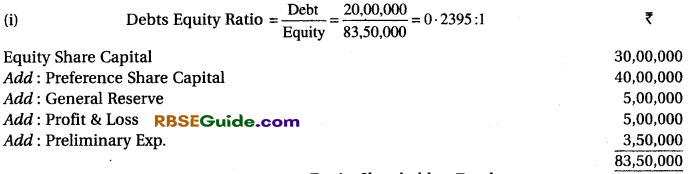
Capital Gearing Ratio = ![]()
Equity Shareholders Fund = 83,50,000 – 40,00,000 = 43,50,000
Long-term Debts + Pre. Share Cap. = 20,00,000 + 40,00,000 = ₹ 60,00,000
Capital Gearing Ratio = \(\frac { 43,50,000 }{ 60,00,000 } \) =0 . 725 : 1
(iii) Liquid Ratio =
![]()
Liquid Assets = Debtors + Cash = 20,00,000 + 1,00,000 = ₹ 21,00,000
Current Liabilities = Trade Creditors + Outstanding Exp. + Provision for Taxation + Proposed Dividend
= 6,00,000 + 1,50,000 + 2,00,000 + 3,00,000
= ₹ 1 2,50,000
So, liquid Ratio is =
![]()
= \(\frac { 21,00,000 }{ 12,50,000 } \) = 1 . 68 : 1
![]()
Illustration 11.
From the following information calculate interest coverage ratio:
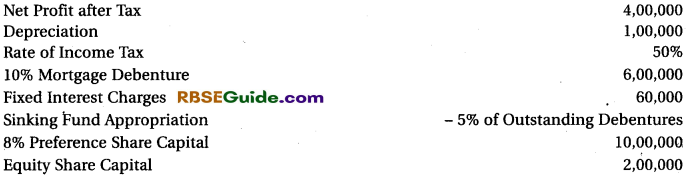
Solution:
or
Profit after Tax =
![]()
= \(\frac { 4,00,000 }{ 0.5 } \) = ₹ 8,00,000
Net Profit before Interest and tax =8,00,000 + 60,000 Interest ₹ 8,60,000
Interest Coverage Ratio = \(\frac { 8,60,000 }{ 60,000 } \) = 14 . 33 times
3. Activity Ratios
These ratios measure how well the facilities at the disposal of the concern are being utilised. These ratios are known as ‘Turnover Ratios’ as they indicate the rapidity with which the resources available to the concern are being used to produce sales.
In other words, these ratios measure the efficiency and rapidity of the resources of the company like stock, fixed assets, working capital, debtors etc. These ratios are generally calculated on the basis of sales or cost of sales. Some of the important activity ratios are discussed below.
(i) Inventory or Stock Turnover Ratio:
This ratio indicates the relationship between the cost of goods sold during the year and average stock kept during that year.
Inventory Turnover Ratio =
![]()
(a) Cost of goods sold can be calculated by two ways :
Cost of Goods Sold = Opening Stock + Purchase + Carriage + Wages + Other Direct Charges – Closing Stock
Or
Cost of Goods Sold = Net Sales – Gross Profit
Significance: This ratio indicates whether stock has been efficiently used or not. It shows the speed with which the stock is rotated into sales or the number of times the stock is turned into sales during the year. The higher the ratio the better it is since it indicates that stock is selling quickly.
In a business where stock turnover ratio is high goods can be sold at a low margin of profit and even then the profitability may be quite high. A low stock turnover ratio indicates that stock does not sell quickly and remains lying in the godown for quite a long time. This results increased storage costs blocking of funds and losses on account of goods becoming obsolete or unsaleable.
![]()
Illustration 12.
Calculate the stock turnover ratio from the information given below:

Solution:
Stock Turnover Ratio =
![]()
= \(\frac { 50,000 }{ 17,500 } \) = 2.86 : 1
Cost of Goods Sold Opening Stock + Purchase + Carriage Inward – Closing Stock
= 20,000 + 40,000 + 5,000 – 15,000 = ₹ 50,000
Average Stock =
![]()
\(\frac { 20,000+15,000 }{ 2 } \) = ₹ 17,500
![]()
Illustration 13.
Calculate the stock turnover ratio from the following information:
![]()
Solution:
Stock Turnover Ratio =
![]()
= { 2,80,000 }{ 25,000 } [/latex] = 11 . 2 : 1
Cost of Goods Sold = Sales – Gross Profit
4,00,000 – 1,20,000 = ₹ 280,000
Average Profit =
![]()
= { 20,000+30,000 }{ 2 } [/latex] = ₹ 25,000
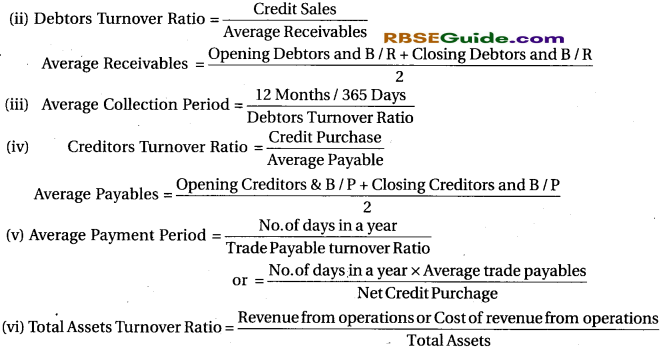
Debtors Turnover Ratio or Receivables Turnover Ratio : Trade receivables is the amount receivable against goods sold or services rendered in the normal course of business by the enterprise. In other words, amount remaining outstanding against sales of goods or services rendered are trade receivables.
Trade receivables include debtors and bills receivable. Trade receivables turnover ratio establishes the relationship between credit revenue from operations i.e., net credit sales and average trade receivables i.e., average of debtors and bills receivable of the year. Average trade receivables are calculated by dividing the sum of trade receivables in the beginning and at the end by 2.

Notes:
(i) Credit Revenue from Operations = Credit Sales – Sales Return
Or
Credit Revenue from Operations = Revenue from Operations – Cash Revenue from Operations
(ii) Average Trade Receivables ![]()
When trade receivables turnover ratio is compared it should be kept in mind that provision for doubtful debts is not deducted from trade receivables. Since the purpose is to calculate the number of days for which sales are tied receivables and not to ascertain realisable value of the debtors.
Objective and Significance : This ratio indicates the number of times trade receivables are turned over in a year in relation to credit sales. It shows how quickly trade receivables are converted into cash and cash equivalents and thus, shows the efficiency in collection of amounts due against trade receivables. A high ratio is better since it shows that debts are collected more prompdy.
A lower ratio shows inefficiency in collection and more investment in debtors than required.
(iii) Debt Collection Period or Average Collection Period: It provides an approximation of the average time that it takes to collect debtors. It is computed by dividing 365 or 12 by the trade receivables turnover ratio. It is calculated as follows :
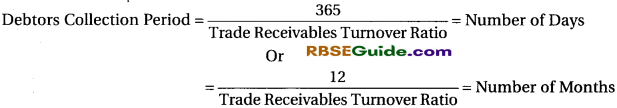
![]()
Illustration 14.
Calculate Debtors Turnover Ratio and Average collection period from the information given below:
Solution:
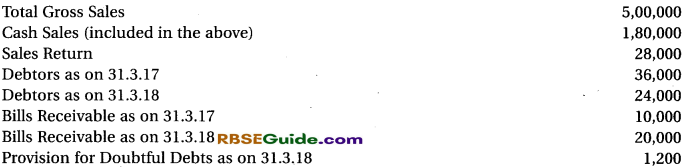
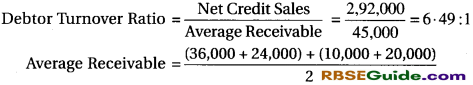
=\(\frac { 90,000 }{ 2 } \) = ₹ 45,000
Net Credit Sales = Total Sales – Cash Sales – Sales Return
= 5,00,000 – 1,80,000 – 28,000 = ₹ 2,92,00O
Average Collection Period = ![]() x 365
x 365
= \(\frac { 45,000 }{ 2,92,000 } \) x 365 = 56.25 or 57 days
(iv) Trade Payables Turnover Ratio : This ratio indicates the relationship between credit purchase and average creditors during the year.
![]()
If the amount of credit purchase is not given in the question, the ratio may be calculated on the basis of total purchase.
Significance: This ratio indicates the speed with which the amount is being paid to creditors. The higher the ratio the better it is since it will indicate that the creditors are being paid more quickly which increases the credit worthiness of the firm.
(v) Average Payment Period: Payables turnover ratio could be converted into average payment period which indicates the period which is normally taken by the firm to make payment to its creditors. It is calculated as follows :
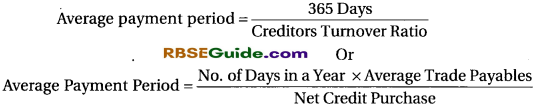
![]()
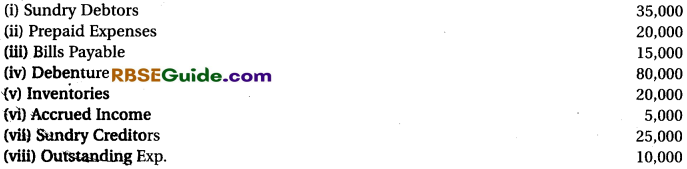
Illustration 15.
A Trader purchases goods both on cash or credit. The following particulars are obtained from his books of accounts, for the year ended 31st March 2018:
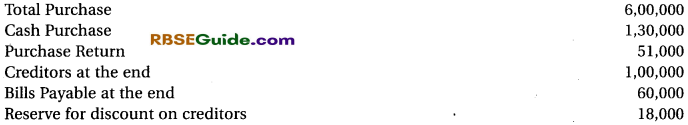
Solution:

Average Payables = Creditors + Bills Payable
= 1,00,000 + 60,000 = ₹ 1,60,000
Net Credit Purchase = Total Purchase – Cash Purchase – Purchase Return
= 6,00,000 – 1,30,000 – 51.000 = ₹ 4,19,000
(v) Total Assets Turnover Ratio: Working capital turnover ratio shows the relationship between Total Assets and revenue from operations. It shows the number of times a unit of rupee invested in Total Assets produces sales.
Revenue from operations means revenue earned by the company from its operating activities i.e., revenue producing activities. It includes net sales and commission etc. for non-finance company and interest earned dividend profit on sale of securities etc. in the case of finance companies.
If the amount of revenue from operations is not given it may be calculated on the basis of cost of revenue from operations (cost of goods sold.)
Total Assets = Non Current Assets (Tangible Assets + Intengible Assets + Non current investment + Long term loans and Advances) + Current Assets
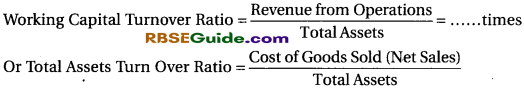
Objective and Significance: The objective of computing the ratio is to ascertain whether or not Assets has been effectively used in generating revenue. Assessment of effective utilisation can be made by comparing with the past data or with comparable enterprise or with the industry standards.
![]()
Illustration 16.
Calculate the total assets turnover ratio from the following information:
Land and Building 70,000, Plant & Machinery 40,000, Furniture 15,000, Non-current Investment 10,000, Stock 15,000, Debtors 10,000, B/R 4,000, Cash in Hand 12,000, Cash at Bank 4,000. Net sales during the year 6,00,000.
Solution:

4. Profitability Ratios
The main object of every business concern is to earn profits. A business must be able to earn adequate profits in relation to the capital invested in it. The efficiency and the success of a business can be measured with the help of profitability ratios. The following are the important profitability ratios :
- Gross profit ratio
- Operating ratio
- Operating profit ratio
- Net profit ratio
Return on investment (R.O.I.)
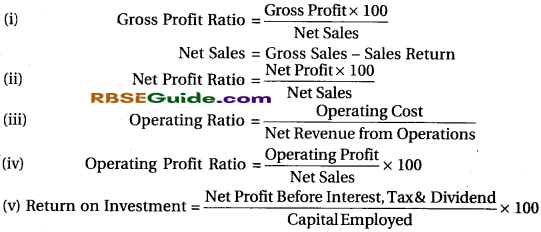
Gross Profit Ratio : This ratio shows the relationship between gross profit and sales. The formula for computing this ratio is :
![]()
Net Sales = Sales – Sales Return
Gross Profit = Not Revenue from operations – Cost of Revenue from operations Net revenue from operations = Revenue from operations – Revenue from operations Return i.e., (Sales return)
Cost of Revenue from operations = Cost of material consumed + purchase of stock in trade + Changes in inventories + direct expenses.
Significance: This ratio measures the margin of profit available on sales. The higher the gross profit ratio the better it is. No ideal standard is fixed for this ratio but the gross profit ratio should be adequate enough not only to cover the operating expenses but also to provide for depreciation, interest on loans, dividends and creation of reserves.
This ratio is compared with earlier year ratio and important conclusions are drawn from such comparison. For instance, if there is a decline in gross profit ratio in comparison to the previous year it may be concluded that;
(a) Price of materials purchased freight wages and other charges may have gone up but the selling price may not have gone up in proportion to the increase in costs.
Or
(b) The selling price may have fallen but the prices of materials, freight, wages and other direct charges may not have fallen relatively.
Or
(c) There may be misappropriation theft or pilferage of stocks during the year.
Or
(d) There is fall in the sale of more profitable varieties of goods.
Or
(e) There is fall in the prices of unsold goods there by reducing the value of closing stock.
(ii) Operating Ratio : This ratio measures the proportion of an enterprises cost of sales and
operating expenses in comparison to its sales
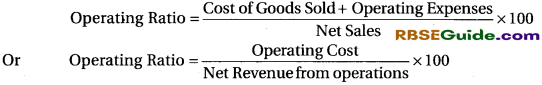
Where, Cost of Goods Sold = Opening Stock+Purchase + Direct Expenses (Carriage, Wages etc.) – Closing Stock
Or
= Sales – Gross Profit
Operating Expenses = Office and Administration Expenses + Selling and Distribution Expenses + Depreciation + Discount + Bad Debts + Interest on Short Term Loans.
Attention: Depreciation is included in operating expenses.
It must be noted that non-operating expenses such as loss on sale of fixed assets, loss from fire, income tax, charities and donations, finance charges, relating to interest on long term debts and interest on debentures etc. are ignored while calculating this ratio. Similarly, non-operating incomes (such as profit on sale of fixed assets and interest and dividend received on investments) are also ignored.
Significance : Operating ratio is a measurement of the efficiency and profitability of the business enterprise. The ratio indicates the extent of sales that is absorbed by the cost of goods sold and operating expenses. Lower the operating ratio, the better it is, because it will leave higher margin of profit on sales.
(iii) Operating Profit Ratio : Operating profit ratio measures the relationship between operating profit and revenue from operations i.e., net sales. Operating profit ratio is computed by dividing operating profit by revenue operations (net sales) and is expressed as percentage. In the form of a formula this ratio is expressed as follows
![]()
Operating Profit = Gross Profit + Other Operating Income – Other Operating Expenses Or Net Profit (Before Tax) + Non-operating Expenses/Losses – Non-Operating Incomes Or Revenue from Operations – Operating Cost
Non-Operating Expenses are those expenses which are not incurred to earn profit. Examples are interest on long term borrowings, loss on sale of fixed assets.
Non-Operating Incomes are those incomes which are not earned from the operating activities of the business. Examples are interest earned on investments, gain (profit) on sales of fixed or non-current assets.
Objective and Significance : The objective of computing the ratio is to determine operational efficiency of the business. An increase in the ratio over the previous period shows improvement in the operational efficiency of the business enterprise.
(iv) Net Profit Ratio : Net profit ratio establishes the relationship between net profit and revenue from operations i.e., net sales. It shows the percentage of net profit earned on revenue from operations.
![]()
Net Profit = Revenue from Operations – Cost of Revenue from Operations – Operating Expenses + Non-Operating Income – Tax
Significance: Net profit ratio is an indicator of overall efficiency of the business higher the net profit ratio better the business. This ratio helps in determining the operational efficiency of the business. An increase in the ratio over the previous period shows improvement in the operational efficiency and decline means otherwise. A comparison with the industry standard is also an indicator of the efficiency of the business.
(v) Return on Investment or Return on Capital Employed : This ratio shows relationship between net profit before tax & interest and invested capital, its calculate as follows :
![]()
Capital Employed = Shareholders funds + Non- current liabilities
Or
Capital Employed = Non- Current Assets + Working Capital
![]()
Illustration 17.
The following information have been obtained from the financial records of Ram Limited:
Net Sales ₹ 3,00,000, Cost of Goods Sold ₹ 2,00,000, Indirect Expenses ₹ 40,000. From the above information compute operating ratio.
Solution:
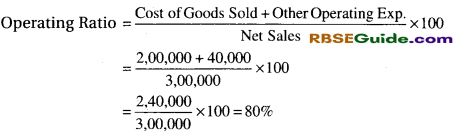
It is assumed that indirect exp. of 40,000 is other operating exp.
![]()
Illustration 18.
Following was the Trading and P & L account of Aruna Ltd. for the year ended 31st March, 2018:
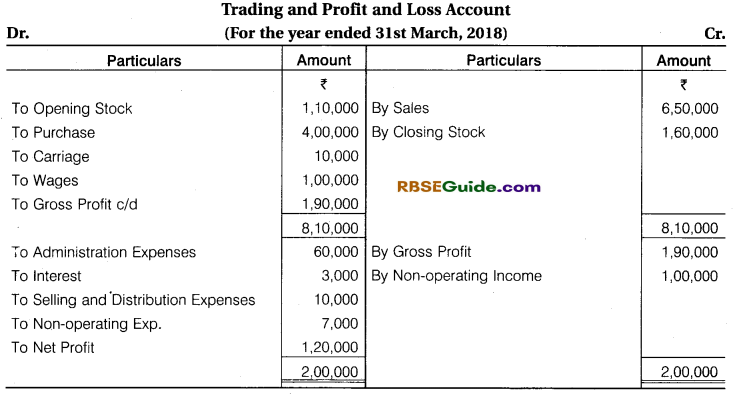
From the above information calculate the following ratios:
- Gross Profit Ratio
- Net Operating.Profit Ratio
- Operating Ratio
- Administration Exp. Ratio
- Selling and Distribution Exp. Ratio
- Net Profit Ratio
Solution:
1. Gross Profit Ratio =
![]()
\(\frac { 1,90,000 }{ 6,50,000 } \) x 100 = 29.23%
2. Net Operating Profit Ratio Operating Net Profit
![]()
\(\frac { 1,17,000 }{ 6,50,000 } \) x 100 = 18%
Operating Net Profit = Net Profit + Non operating Exp. – Non operating Income = 1,20,000 + 7,000 – 10,000 = ₹ 1,17,000
3.
Operating Ratio
![]()
\(\frac { 5,33,000 }{ 6,50,000 } \) x 100 = 82%
Operating Cost = Cost of Goods Sold + Other Operating Exp. = 4,60,000 + 73,000 = 5,33,000
Cost of Goods sold = Opening Stock + Purchase + Carriage + Wages – Closing Stock = 1,10,000 + 4,00,000 + 10,000 + 1,00,000 – 1,60,000
= 4,60,000
Other Operating Expenses = Adm. Exp. + Selling Exp. + Interest
= 60,000 + 10,000 + 3,000 = ₹ 73,000
4. Administration Expenses Ratio
![]()
\(\frac { 60,000 }{ 6,50,000 } \) x 100 = 9.23%
5. Selling and Distribution Expenses Ratio
![]()
\(\frac { 10,000 }{ 6,50,000 } \) x 100 = 1.54%
6. Net Profit Ratio
![]()
\(\frac { 1,20,000 }{ 6,50,000 } \) x 100 = 18.46%
5. Investment Analysis Ratios
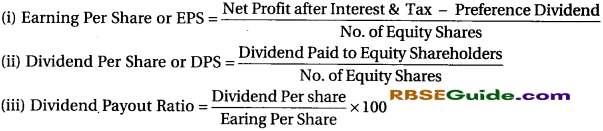
(i) Earning Per Share :
Earning per share (EPS) ratio measures the earning capacity of the concern from the owner’s point of view and it is helpful in determining the price of the equity share in the market place. Earning per share ratio can be calculated as :
![]()
Advantages:
- This ratio helps to measure the price of stock in the market place.
- This ratio highlights the capacity of the concern to pay dividend to its shareholders.
- This ratio used as a year stick to measure the overall performance of the concern.
(ii) Dividend Per Share: Dividend per share (DPS) is the dollar amount of cash dividends paid during a period per share of common stock.
![]()
(iii) Dividend Payout Ratio:
This ratio highlights the relationship between payment of dividend on equity share capital and earning per share. This ratio indicates the dividend, policy adopted by the top management about utilisation of divisible profit to pay dividend or to retain or both. The ratio thus can be calculated as
![]()
![]()
Illustration 19.
Calculate return on capital employed on the basis of:
- Gross capital employed
- Net capital employed
- Average capital employed with the help of the following figures :
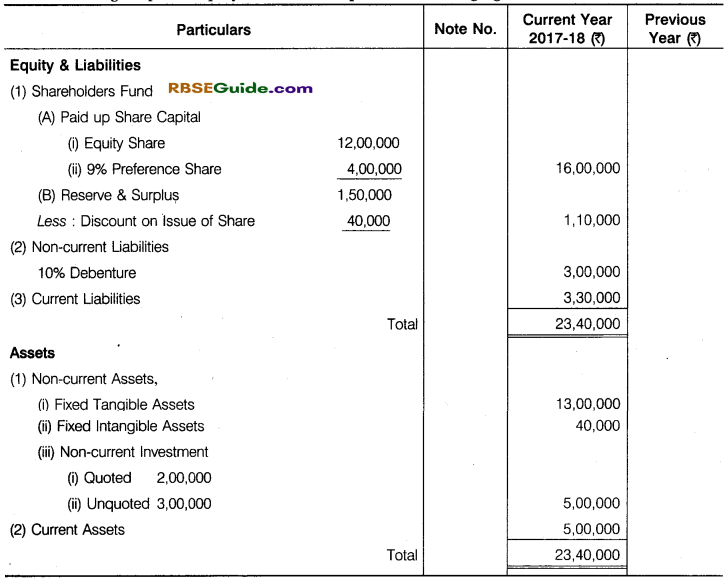
being non-trade investment.
Other Information
- Reserve and Surplus include current year’s profit of ₹ 25,000 after interest on debenture for one year and tax provision of ₹ 25,000.
- Income from quoted investment @ 8% is included in current years profit, such investment
- Net capital employed at the beginning of the year was 16,50,000.
- Patent will be realised at their book value.
Solution:
Calculation of Net Capital Employed
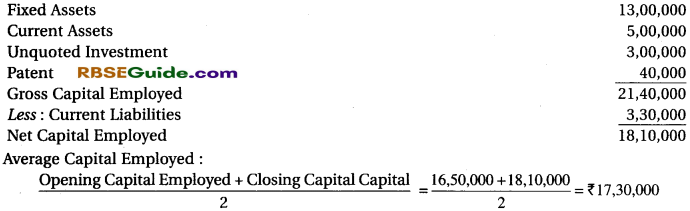
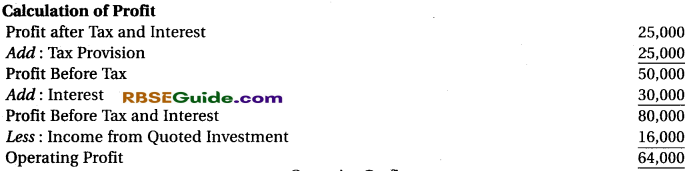
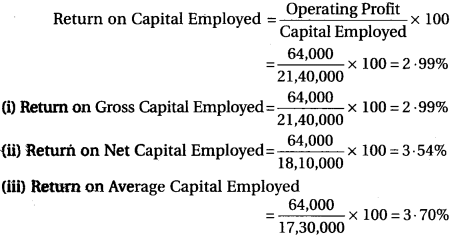
Illustration 20.
The following information is given for a company whose accounting year ended on 31st March 2018:
Calculate return on capital employed.
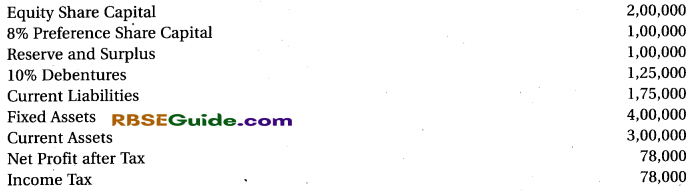
Solution:
(i) Return on Gross Capital Employed:
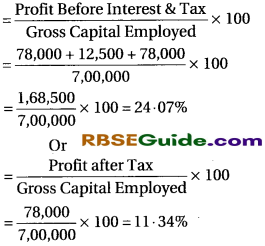
Gross Capital Employed = Fixed Assets + Current Assets = 4,00,000 + 3,00,000 = ₹ 7,00,000
(ii) Return on Net Capital Employed =
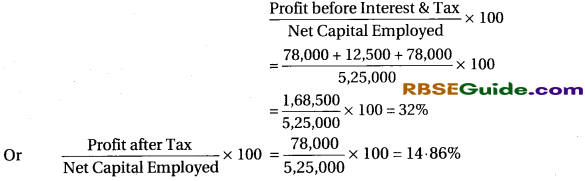
Net Capital Employed Total Assets – Current Liabilities
= 7,00,000 – 1,75,000 = ₹ 5,25,000.
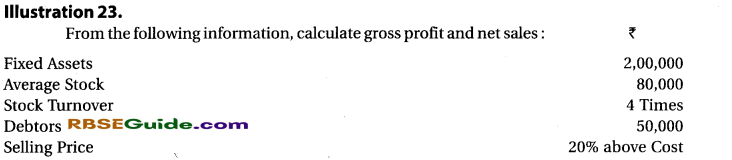
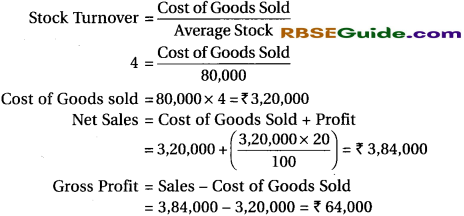
Illustration 21.
From the following informations, calculate:
(i) Return on Shareholders Fund
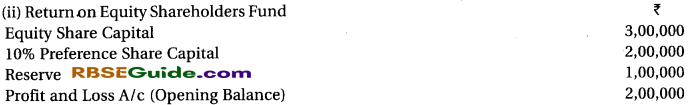

Solution:
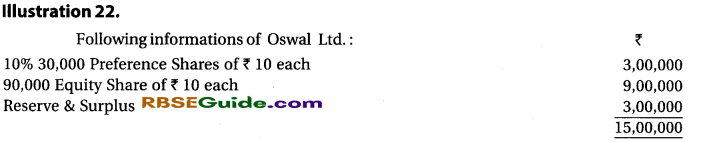
Other Informations:
- Profit 3,00,000 after 50% Income Tax.
- 20% Dividend on Equity Shares
- Market Value of Equity Share 50 each.
Calculate:
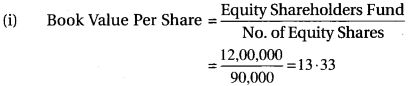
- Book Value per Share
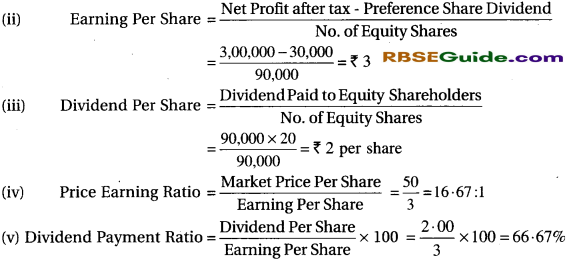
- Earning per Share
- Dividend per Share
- Price Earning Ratio
- Dividend Payment Ratio.
Solution:
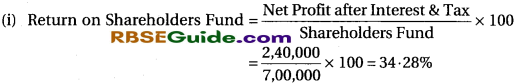
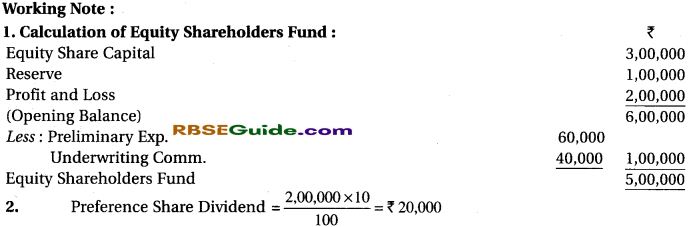
Working Note:
Equity Shareholders Fund = Equity Share Capital + Reserve Surplus
= 9,00,000 + 3,00,000 = ₹ 12,00,000
Solution:
Formulas of Accounting Ratios at a Glance
1. Liquidity Ratios

2. Solvency Ratios
![]()
If current liabilities are not included in external fund. Then, its calculation will done by following formula:
![]()
Long-term Debts = Debentures + Long Term Loans + Mortgage etc.
Share-holders Fund = Equity or Preference Shares + Reserve – Preliminary Exp. – Discount & Loss on Issue of Shares & Debentures – Non-operation Investment

3. Activity Ratio
![]()
Cost of Goods Sold = Opening Stock + Purchase + Direct Exp. – Closing Stock
Or
Cost of Goods Sold = Sales – Gross Profit
![]()
4. Profitability Ratio
(a) Based on Sales:
5. Investment Analysis Ratios:
Ratio Analysis Notes Important Terms
→ Ratio : It is an arithmetical expression of relationship between two interrelated or related items.
→ Accounting Ratios : Accounting ratio means ratio calculated on basis of accounting informations.
→ Pure Ratio : It is a ratio expressed as quotient, for example 2:1. Percentage : It is a ratio expressed in percentage, for example 25%.
→ Times : It is a ratio expressed in number of times, for example 3 times.
→ Fraction : It is a ratio expressed fraction, for example \(\frac { 3 }{ 4 } \) or 0.75.
→ Liquidity Ratios : These ratios show the ability of the enterprise to meet its short term financial commitments. These include current ratio and quick ratio/liquid ratio/acid test ratio.
→ Trade Payables : Total of pay to Bills Payable and to creditor of organisation.
→ Trade Receivables : Total of receiving amount from bills receivable and debtor’s of organisation.
→ Fixed Interest Charges : Interest payable on long term loan of an organisation.
→ External Equity : Total of long term loan, long term provision and current liabilities of an organisation.
→ Fictitious Assets : Those expenses which were not write off like, expenses on issue of shares and debentures, discount and loss on issue of shares and debentures, underwriting commission and preliminary expenses etc.
→ Cost of Revenue from Operation : Cost material consumed + Purchased of stock-in-trade + Changes in inventory + Direct expenses (carriage, wages, etc.)
Operating Expenses : Other expenses related operation other then cost of revenue from operations Like, employees benefit expenses, depreciation, office and administrative expenses, selling and distribution expenses, discount, bad debts, interest on short term loans etc.
→ Earning per share (EPS) : Earn amount of profit on each equity share by an organisation,
→ Dividend per share (DPS) : Distributed dividend to each equity share holders by an orgnisation.
→ Operating Profit : Excess of net revenue on operating cost by operational activities,
→ Gross Profit : Excess of net revenue on cost of revenue from operational activities.
→ Net Profit: Total profit of operational and non-operational activities of an organisation.