Rajasthan Board RBSE Class 11 Economics Chapter 10 Mode
RBSE Class 11 Economics Chapter 10 Text book Questions
RBSE Class 11 Economics Chapter 10 Multiple Choice Questions
Question 1.
Which of the following is the most uncertain mean?
(a) Mode
(b) Arithmetic mean
(c) Median
(d) Harmonic mean
Answer:
(a) Mode
Question 2.
Which is the value of that item whose frequency is the maximum in the series?
(a) Arithmetic mean
(b) Median
(c) Mode
(d) All of these
Answer:
(c) Mode
Question 3.
The suitable mean for size of ready made clothes is:
(a) Median
(b) Mode
(c) Arithmetic mean
(d) None of these
Answer:
(b) Mode
![]()
Question 4.
The lower limit of the mode-class, if mode has to be determined from the following data-item series, will be :
| X | F |
| 0-9 | 2 |
| 10-19 | 5 |
| 20-29 | 16 |
| 30-39 | 12 |
| 40-49 | 4 |
(a) 19
(b) 20
(c) 19.5
(d) 29.5
Answer:
(b) 20
Question 5.
Which mean is affected the least by extreme values?
(a) Arithmetic mean
(b) Geometric mean
(c) Median
(d) Mode
Answer:
(d) Mode
RBSE Class 11 Economics Chapter 10 Very Short Answer Type Questions
Question 1.
The average man in Rajasthan wears size number 7 shoes. Which statistical mean does this statement indicate?
Answer:
Mode.
Question 2.
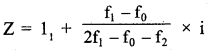
Write the general formula for determination of mode value in a continuous series.
Answer:
Question 3.
Define mode.
Answer:
Mode is that item in a data-item series whose frequency is the greatest.
Question 4.
What are the methods of determining mode?
Answer:
Following are the methods of determining mode-
- By inspection
- By grouping
![]()
Question 5.
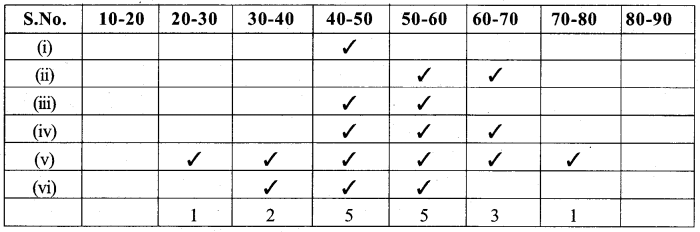
Write the alternative formula for determining mode.
Answer:
RBSE Class 11 Economics Chapter 10 Short Answer Type Questions
Question 1.
Find the mode if median is 21 and arithmetic mean is 20.
Answer:
Question 2.
In which situation is ‘density test’ used in mode?
Answer:
Density test is used in mode when the frequency of the data series is random or irregular because, in such a situation, the maximum frequency is not detected. Density testing is used when there are irregularities found in the decrease- increase or concentration in frequencies, etc.
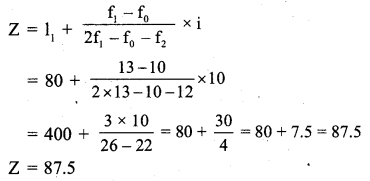
Question 3.
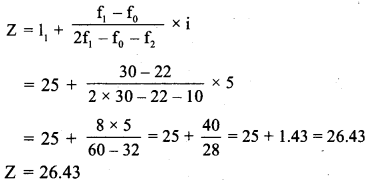
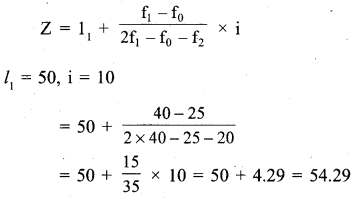
If the mode-class is (50 – 60) and f1 = 40, f0 = 25 and f2 = 20, find the mode.
Answer:
Question 4.
Explain grouping method.
Answer:
First of all, a table is made in grouping method, in which there are 6 columns for additional frequencies apart from variable values (x).
| Serial Number | Variable-value (x) |
| 1. | Frequencies (f) |
| 2. | Sum of 2-2 frequencies |
| 3. | Sum of 2-2 frequencies except first frequency |
| 4. | Sum of 3-3 frequencies |
| 5. | Sum of 3-3 frequencies except first frequency |
| 6. | Sum of 3-3 frequencies except first two frequencies |
After grouping the frequencies in the above manner, each column’s greatest frequency is circled with a pencil and by marking the variable values of these greatest frequencies, calculation are done through analytical table. The variable-value having the greatest number of marks in front of it is the mode value.
Question 5.
Mention the uses of mode.
Answer:
Following are the uses of mode :
- The mode is used by common people in routine life to a great extent.
- The mode is a useful mean in meteorology, life-sciences, consumer incomes, etc.
- The mode is thought to be more indicative and leading in business forecasting or prognostication.
- Rainfall, wind-speed, heat-related forecasts are made using mode.
![]()
RBSE Class 11 Economics Chapter 10 Long Answer Type Questions
Question 1.
Find the mode from the following table using grouping method:
| Central size | Frequency |
| 15 | 5 |
| 25 | 9 |
| 35 | 13 |
| 45 | 21 |
| 55 | 20 |
| 65 | 15 |
| 75 | 8 |
| 85 | 3 |
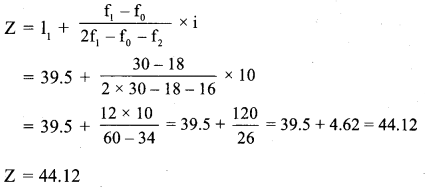
Answer:
Grouping :
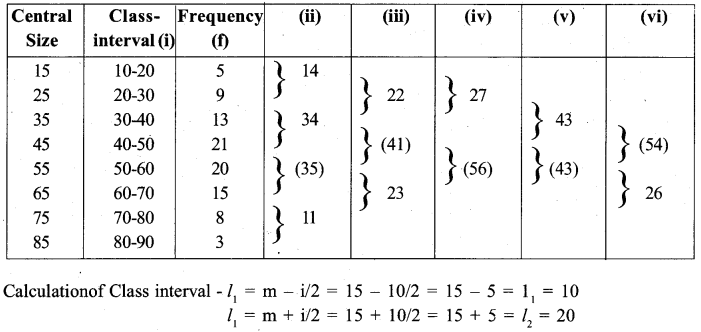
Analytical Table Class – Interval :
It can be seen from the above table, that the maximum frequency occurs 5-5 times in both class-intervals (40-50) and (50-60). Thus, to determine the mode class between the two, we’ll have to carry out a density test :
| Class / Frequency | 40-50 | 50-60 |
| f0 | 13 | 21 |
| f1 | 21 | 20 |
| f2 | 20 | 15 |
| Frequency | 54 | 56 |
So, mode class is (50 – 60) whose frequency is 56.
![]()
Question 2.
Find the mode from the following data values :
| Size | Frequency |
| 8 | 3 |
| 10 | 7 |
| 12 | 12 |
| 14 | 28 |
| 16 | 10 |
| 18 | 9 |
| 26 | 6 |
Answer:
| Size | Frequency |
| 8 | 3 |
| 10 | 7 |
| 12 | 12 |
| 14 | 28 |
| 16 | 10 |
| 18 | 9 |
| 20 | 6 |
This is regular series. Thus, the mode can be found out by inspection, (highest frequency = 28)
So Mode ( Z) = 14
Question 3.
Find the mode and Q1 and Q2 from the following table:
| Income | Number of Persons |
| 100-200 | 15 |
| 100-300 | 33 |
| 100-400 | 63 |
| 100-500 | 83 |
| 100-600 | 100 |
Answer:
| Income (₹) | No. of Persons (cf) | f |
| 100-200 | 15 | 15 |
| 200-300 | 33 | 18 |
| 300-400 | 63 | 30 |
| 400-500 | 83 | 20 |
| 500-600 | 100 | 17 |
| 100 |
It is found out by inspection that the maximum frequency is 30 which is in the class-interval 300-400.
Calculation of low quartile (Q1)

The item 25th is in the cumulative frequency 33 which is in class-interval (200 – 300).
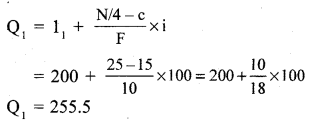
![]()
The size of 75th item is in the 83 cumulative frequency which is in the class 400-500. Thus
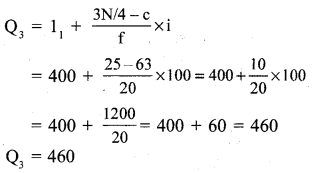
![]()
RBSE Class 11 Economics Chapter 10 Other Important Questions
RBSE Class 11 Economics Chapter 10 Objective Type Questions
Question 1.
The appropriate mean for knowing the average size of shoes is :
(a) Median
(b) Mode
(c) Arithmetic Mean
(d) None of these
Answer:
(b) Mode
Question 2.
Which of the following is not mathematical mean?
(a) Arithmetic Mean
(b) Geometric Mean
(c) Mode
(d) Harmonic Mean
Answer:
(c) Mode
Question 3.
Which mean is used in grouping method?
(a) Arithmetic Mean
(b) Median
(c) Mode
(d) Geometric Mean
Answer:
(c) Mode
Question 4.
Which average in a series can sometimes not be known by its general formula?
(a) Arithmetic Mean
(b) Mode
(c) Median
(d) None of these
Answer:
(b) Mode
![]()
Question 5.
The mode in 2, 5, 3, 5, 2, 1, 7, 10, 5, 9 is :
(a) 3
(b) 7
(c) 5
(d) 10
Answer:
(c) 5
RBSE Class 11 Economics Chapter 10 Very Short Answer Type Questions
Question 1.
What is Bahulak (बहुलक) called in English?
Answer:
Mode.
Question 2.
How did the word ‘mode’ originate?
Answer:
From the French language word ‘La Mode’.
Question 3.
What is the meaning of ‘La Mode’?
Answer:
Fashion or custom which is prevalent.
Question 4.
What kind of mean is mode?
Answer:
Mode a place-related mean.
Question 5.
What is the symbol of mode?
Answer:
Z.
Question 6.
How many methods are there to find the mode in the individual series?
Answer:
Three Methods
![]()
Question 7.
Write the names of methods to find the mode in the individual series.
Answer:
- Converting individual series into discrete series.
- Converting into continuous series.
- Estimation of Mode with the help of Arithmetic mean and median.
Question 8.
How many methods of determining the mode are there in a discrete series?
Answer:
Two.
Question 9.
Define mode.
Answer:
The mode is that value whose frequency is the greatest in the series.
Question 10.
Write two properties of mode.
Answer:
Following are the two properties of mode:
- It is not affected by extreme values
- Its calculation is possible by graphical method.
Question 11.
Write two flaws of mode.
Answer:
Following are the two flaws of mode:
- Changing the class-magnitude also changes its value.
- Where extreme values should be determined, its calculation is not suitable.
Question 12.
Write two utilities of mode.
Answer:
Following are the two utilities of mode :
- For finding the maximum frequency point of values.
- Mode is considered more useful in business forecasts or predictions.
![]()
Question 13.
Find out mode from the following data :
| Obtained marks | 30 | 38 | 46 | 52 | 60 | 68 |
| No. of Students | 10 | 15 | 25 | 20 | 15. | 11 |
Answer:
It is clear in series that the maximum frequency is 25 and its value is 46. So 46 is mode.
RBSE Class 11 Economics Chapter 10 Short Answer Type Questions
Question 1.
What are the main differences between mode and median?
Answer:
Difference between mode and median :
- The mode is the value which has the highest frequency, while the median series is placed in ascending or descending order, there is a middle term which divides the series into two equal parts. On one side lie lesser values than the median, and on the other side lie higher values than the median.
- The calculation of mode can be done by inspection, but the median cannot be calculated merely by inspection.
Question 2.
Write the four characteristics of mode.
Answer:
Following are the four characteristics of mode :
- This is a simple and intelligible mean.
- It is not affected by extreme values.
- This is the most probable value of the distribution.
- Its calculation is possible by the graphical method.
Question 3.
Write the four flaws of mode.
Answer:
Following are the four flaws of mode :
- Its algebraic investigation is not possible.
- It is not always possible to calculate mode. Sometimes there is more than one mode in the series.
- Where the extreme terms are to be given importance, its calculation is not suitable.
- Changing the class-magnitude also changes its value.
![]()
Question 4.
Where is the mode suitable?
Answer:
Where the information of the most popular value of distribution is to be made, the mode is the most suitable mean. In the business area, it is becoming very popular. This is the best mean to get professional forecasting, know about fashion, ideal wage determination, and the ideal time period for production.
Question 5.
Explain the relation between arithmetic mean, median, and mode.
Answer:
The mutual relationship between these three means depends on whether the series is symmetrical or asymmetrical.
Symmetrical Series :
In these series the value of arithmetic mean, median and mode are equal.
Asymmetric Series :
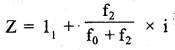
In these series the values of these three means are different and generally (\(\overline { X } \) – Z) is equal to 3 (\(\overline { X } \) – M). In this state if the value of any two means is known then the probable value of the third can be determined by the following formula :
(\(\overline { X } \) – Z)= 3 (\(\overline { X } \) – M)
Z = 3 M 2\(\overline { X } \)
Question 6.
If the arithmetic mean of the distribution is 38.2 and median is 41.6 then what will be the most likely value of the mode?
Answer:
(\(\overline { X } \)-Z)= 3(\(\overline { X } \)-M)
Z = 3M – 2\(\overline { X } \)
Z= (3 × 41.6 ) – (2 × 38.2)
= 124.8 – 76.4
= 48.4
Question 7.
In a simple asymmetric series, the mode is equal to the difference between three times the median and twice the arithmetic mean. If the arithmetic mean is 15.6 and median is 15.73 then what will be the most probable value of the mode?
Ans.
Z= 3M -2\(\overline { X } \) = ( 3 × 15.73) – (2 × 15.6)
Z= 47.19 – 31.20
Z = 15.99
![]()
RBSE Class 11 Economics Chapter 10 Long Answer Type Questions
Question 1.
Define Mode. Explain the merits-demerits of mode and clarify its uses.
Answer:
Another important measure of determining central tendency is the mode. The value that comes most often in the value series is called mode. It, means that the value for which the frequency is highest is called mode. For example, if the shops of size number ‘7’ are worn by most people, then the size ‘7’ will be mode.
Important definitions of mode :
- According to Dr. Bowley :
“The value of the classified quantity in a statistical group (wages, height, or any other measurable quantity) where the registered number is highest, is called the mode, or more density place, or the most important value. - According to Prof. Cannon :
“The mode is that value which has been repeated most frequently in the category.” From the above definitions, it is clear that the mode is the value that occurs most often in the series. The mode is expressed hy the ‘Z’ or ‘M0’ of the English language.
Following are the merits of mode :
- Simple and popular :
This is a simple and popular mean. In some circumstances it is calculated only by inspection. This mean is very popular in daily life. Daily usage items, e.g. average size in stitched clothes, etc. implies the mode. - Best representation :
The value of the mode is the one whose recurrence is the highest. So it is the best representative of the series. Its value is also from among the values of the series. - Minimal impact of extreme values :
Another important feature of mode is that it is not affected by the extreme values of the series. Extreme values have a great effect on the arithmetic mean. - The calculation of all the frequencies is not necessary :
To calculate it, there is no need to know the frequency of all the values in the series. Only the preceding and succeding frequencies of the mode class serves the purpose.
Following are the demerits of mode :
- Uncertainty and ambiguity :
Its biggest flaw is its uncertainty and ambiguity. If the frequency of all the values in the series is equal, then it cannot be calculated. Also, many times the series has more than one mode. All this reflects the uncertainty of this mean. - Lack of algebraic interpretation :
This flaw is also found in mode like the median. Its algebraic manipulation is not possible. Due to this defect, the use of this mean is very rare in many statistical methods. - Complexity in the calculation process :
If the mode is determined by inspection method then it remains simpler, otherwise it becomes very difficult for the layman to compute it through grouping and interpolation process.
Utility of Mode :
Mode is used by common people in routine life to a great extent. Mode is a useful mean in business sphere, meteorology, life-sciences, consumer preference, etc. Especially the greatest concentration point of values, such as average collar size, monthly expenses of students, number of average telephone calls per day, the number of words in an average page of a book, average number of children per couple, etc. can be determined using mode. Mode is thought to be more indicative and leading in business forecasting or prognostications. Rainfall, wind-speed, heat-related forecasts are made using mode. In this way, mode is very useful in practical life.
![]()
Question 2.
Explain the method of calculating mode in individual and discrete series with examples.
Answer:
Process of determining Mode :
In individual series :
There are three methods of finding mode in individual series.
- By inspection :
In this method, various values are inspected and the value that occurs the most in the series, is the mode. - By converting the individual series into discrete series.
- By converting the individual series into continuous series :
If all the terms in the series occur once, then, in that case, for calculating the mode, the series will have to be converted into continuous series. Then according to the continuous series process, the mode is calculated.
Example 1.
Following are the monthly incomes of 10 employees of a company. Find out the mode monthly income :
| Monthly Income (In ₹) | 2000 | 2220 | 1800 | 2000 | 1600 |
| 2100 | 2000 | 2400 | 2000 | 1900 |
Solution:
In the above example, there are 4 employees of 2000 monthly income, this is the highest number of employees, so the ₹ 2000 monthly income will be mode income. That is to say that Z = ₹ 2000.
Example 2.
Find out the mode from the following data :
9, 2, 7, 4, 8, 6, 10, 11
Solution:
There is no value repeated in this question more than once, so the mode here is ambiguous.
Example 3.
The following series has the sizes of shoes that are worn by the customers. Find out the mode shoe size :
4, 3, 4, 5, 6, 7, 6, 4, 5, 7, 3, 7, 8, 7, 9, 6
Solution:
Firstly, this class will be converted to discrete series-
| Size of Shoes | 3 | 4 | 5 | 6 | 7 | 8 | 9 |
| No. of Customers (f) | 2 | 3 | 2 | 3 | 4 | 1 | 1 |
The maximum frequency is 4, whose value is 7, so the mode size of the shoes = 7.
There are two methods to calculate mode in discrete series :
- By Inspection Method
- By Grouping Method
By Inspection Method :
In this method, the series is inspected and the value at which the frequency is highest, that value is the mode.
![]()
Example 4.
Find out the mode from the following term series :
| Age | 9 | 10 | 11 | 12 | 13 | 14 | 15 |
| No. of Boys | 2 | 3 | 12 | 9 | 7 | 4 | 2 |
Answer:
It is clear from inspection that the frequency of age 11 has the highest number of boys (12). So the mode age = 11 or Z = 11 years.
By Grouping Method :
When irregularity is found in different values of the series and the frequency of two or more values is highest, it is not possible to determine which value should be considered as a mode, in such a situation the mode is determined by the grouping method. With this method, two tables are formed to determine the mode-
- Grouping Table
- Analytical Table
1. Procedure of preparing Grouping Table :
Under this process, the frequencies are adjusted by widening the groups into which they fall until a modal size of item or a group presents itself. A grouping table has six columns for frequencies apart from one separate column for value, which are prepared as follows:
- First Column :
The frequencies given in the question are written in it. - Second Column:
In this column, add the 1st and 2nd frequencies, 3rd frequencies and 4th frequencies and so on. - Third Column:
In the third column, leaving the first column once again leave the first frequency and then group the remaining in two’s, i.e. add the 2nd and 3rd frequencies, 4 and 5th frequencies, and so on. - Fourth Column:
- In column 4, group the frequencies in three’s, i.e. leaving the first column again, add 1st, 2nd and 3rd frequencies, 4th, 5th and 6th frequencies, and so on.
- Fifth Column:
In column 5 leave the first frequency and group the remaining ‘ in three’s. - Sixth Column:
In column 6 leave the first two frequencies and then group the remaining in three’s.
After preparing the above columns the highest frequency of each column is underlined.
2. Analysis Table:
After grouping the table, the analysis table is prepared. In this table, values or classes (as the case may be) are written from top, left to right in the series and in the first column, columns 1 to 6 are written down from the top. Now in the order of 6 columns of the frequency of the grouping table, seeing and viewing the maximum frequency of which the value is outlined in the analytical table, it indicates the value in front of the column by putting right mark below it. Later these marks are totaled under the values. The value with the highest sum of marks is the mode.
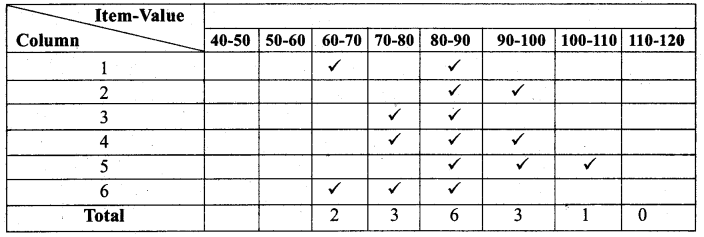
Example 5.
Find out the mode from the following series :
| Item-value | 4 | 5 | 6 | 7 | 8 | 9 | 10 | 11 | 12 | 13 |
| Frequency | 8 | 12 | 16 | 9 | 12 | 10 | 16 | 12 | 9 | 8 |
Determination of mode by grouping method :
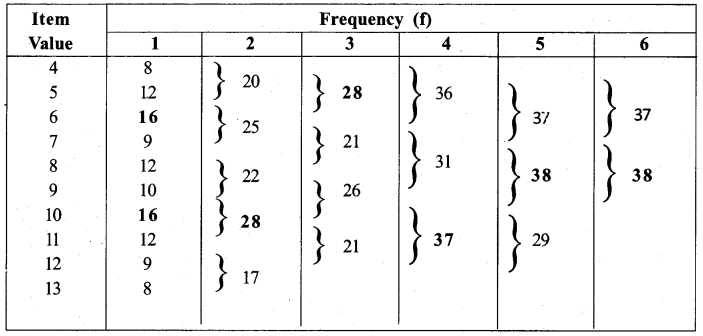
Analytical Table :
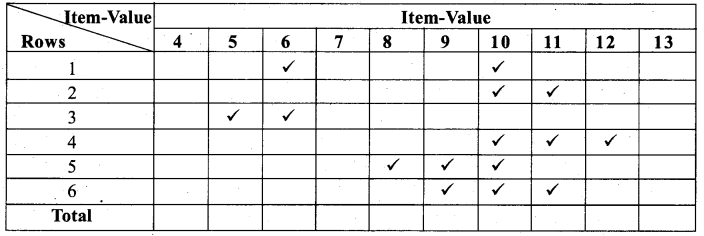
It is clear from the analysis table that the frequency of value 10 is 5 highest, thus mode =10
![]()
Question 3.
Explain the calculation method of the mode in continuous or indiscrete series with the help of examples.
Answer:
In the continuous or indiscrete series, the mode class is first found by either inspection or grouping method. After this, the mode is calculated with the help of the following formula:
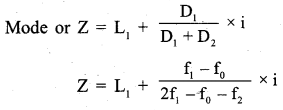
Alternative Formula :
If the value of mode from the above formula comes out of the boundaries of the mode class, then use the following alternative formula.
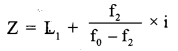
Meaning of the symbols used in formula :
L1 = Lower limit of mode class
D1 = Difference between the mode class and its preceding mode-class
D2 = Difference between the mode class and its succeeding mode-class
i= Class-Interval
f1 = frequency of mode-class
f0= frequency of class preceding mode class
f2= Frequency of class succeeding mode class
Z = Mode
It has to be kept in mind that the class interval of the series is the same. If not, then they have to be made the same. Also, the series must be exclusive. The inclusive series has to be changed to exclusive series. Similarly, if the middle point is given then class intervals have to be computed.
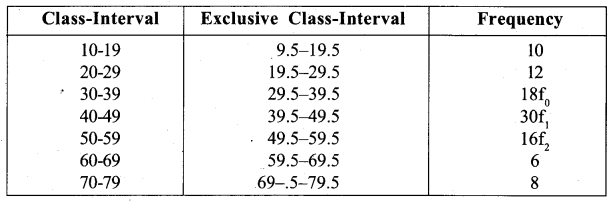
Example 1.
Find out the mode from the following series :

Solution:
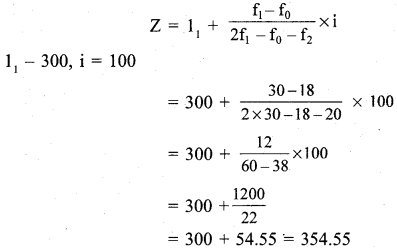
It is clear by the series that the frequency of mode-class 30-40 is highest, Thus, Mode-Class is 30-40. The following formula will be used to calculate the value of mode in this class
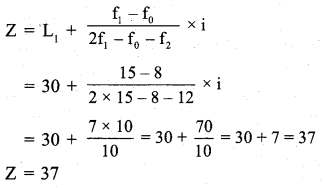
Mode can also be extracted from the following formula :
![]()
Example 2 :
Calculate mode from the following frequency distribution :
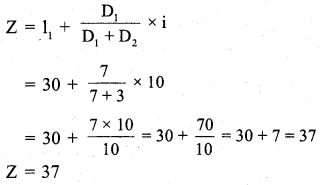
| Wages (More Than) (in ₹) | 30 | 40 | 50 | 60 | 70 | 80 | 90 |
| No. of Workers | 519′ | 469 | 398 | 208 | 104 | 44 | 6 |
Solution:
Firstly, cumulative frequency distribution will be converted into simple frequency distribution.
It is clear by inspection that the mode class is 50-60.
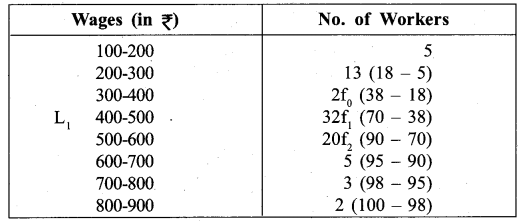
Example 3.
Calculate mode in the following cumulative frequency distribution :
| Wages (Less Than) (in ₹) | 200 | 300 | 400 | 500 | 600 | 700 | 800 | 900 |
| No. of Workers | 5 | 18 | 38 | 70 | 90 | 95 | 98 | 100 |
Solution:
Firstly the series will be converted into simple frequency distribution.
![]()
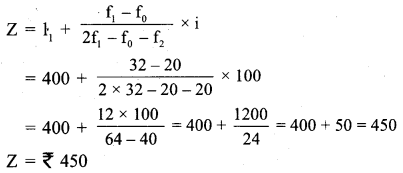
Example 4.
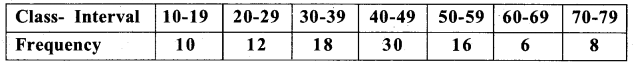
Find out the mode from the following data :
| Mid-Value | 5 | 10 | 15 | 20 | 25 | 30 | 35 |
| Frequency | 10 | 15 | 28 | 35 | 16 | 7 | 4 |
Solution :
We will solve the question by first finding the class-interval.
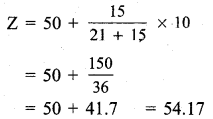
It is clear by the inspection that the mode-class is 17.5-22.5, because its frequency is highest. Now Z is calculated by the following formula :
Example 5.
Find out the mode from the following data :
Solution:
Firstly we will convert inclusive series into exclusive series before solving the question. After that the mode will be calculated by the following way :
Class 39.5 – 49.5 has highest frequency and it is the mode-class.
Example 6.
Find out the mode of the following frequency distribution :

Solution:
In this series the frequency ‘13’ comes twice. Thus, it is not possible to set mode-class by inspection. Therefore, the mode will be determined by grouping method.
Determination of mode by grouping method :
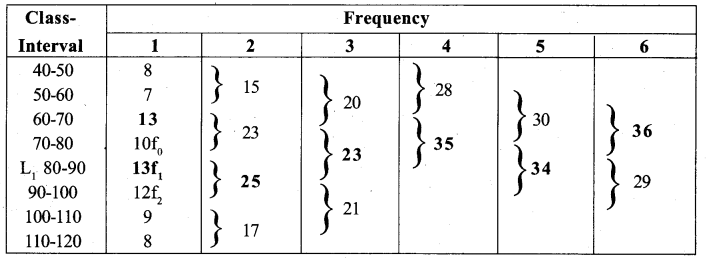
Analytical Table :
It is clear by the analytical table that the mode-class is 80-90.
![]()
Question 4.
How is the mode calculated on the basis of arithmetic mean and median?
Answer:
The mutual relationship between these three averages depends on whether the series is symmetrical or asymmetrical.
Symmetrical Series :
In these series the value of arithmetic mean, median and mode are equal.
Asymmetric Series :
In these series the values of these three average are different and generally ( \(\overline { X } \) – Z) is equal to 3( \(\overline { X } \) – M). In this situation, if the value of the two means is known, then the probable value of the third can be determined by the following formula-
(\(\overline { X } \) – Z)= 3 (\(\overline { X } \) – M)
Z= 3 M-2\(\overline { X } \)
Example :
If the arithmetic mean of the distribution is 20.2 and median is 31.6 then what will be the most likely value of the mode?
(\(\overline { X } \)– Z) = 3(\(\overline { X } \)– M)
Z = 3M – 2\(\overline { X } \)
Z= (3 × 31.6 ) – (2 × 20.2)
= 94.8 – 40.4
= 54.4
Question 5.
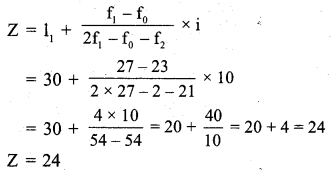
How is the mode calculated by the graphical method? Explain.
Answer:
Calculation of mode by graphical method- In graphical method, the series is represented by the rectangular diagram. The value of mode can be determined graphically only in continuous series, not in discrete series. The following are the steps of calculating mode by graphical method
- According to the given frequency distribution, draw a histogram.
- The highest rectangle in this diagram is modal-class.
- Join the top right and left edges of this rectangle with the top right edges of the rectangle representing the preceding class and the top left edge of the rectangle representing the succeeding class respectively.
- From the point of intersection of both the lines draw a straight line downwards perpendicular on the X-axis. The point where the straight line meets the X-axis gives us the modal – value.
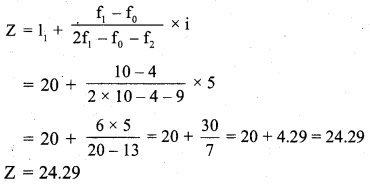
Example :
Find out the mode of the following frequency distribution by the graphical method :
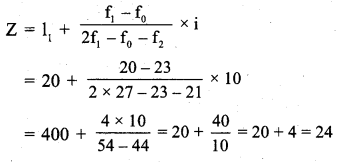
Determination Of Mode By Graphical Method :
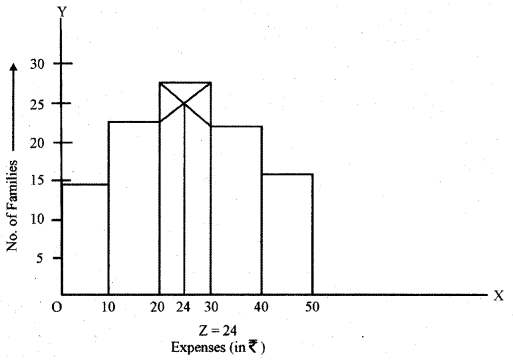
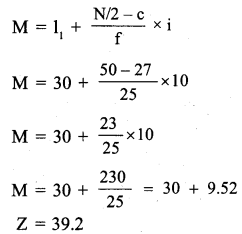
The figure shows the expenditure on X axis and the number of families on the Y axis. The rectangle of 20-30 class is highest. The lines joining both top vertices of the rectangle, with the opposite right and left top vertices of the preceding and succeeding rectangles, intersect one another at the point E. On putting the perpendicular from point E to the X axis, the X axis is intersected on the mode value of the distribution. Therefore Z = 24.
This result can be verified by calculating mode by the following formula :
![]()
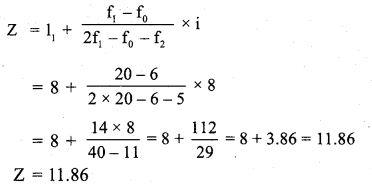
Question 6.
Find out the frequency of class interval (40 – 50) from the following frequency distribution, if the arithmetic mean of distribution is 52 :

Answer:
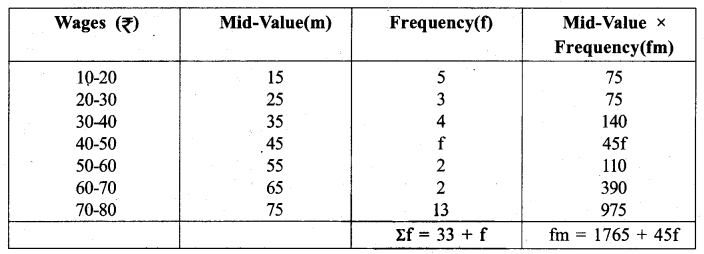
So, the required mode is 7
Question 7.
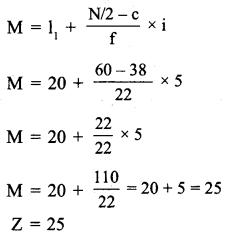
Find out the missing frequencies from the following distribution, if given that N = 100 and M = 30.
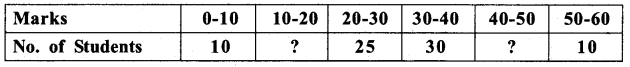
Answer:
Two frequencies are unknown, which we will display with f1 and f2 :
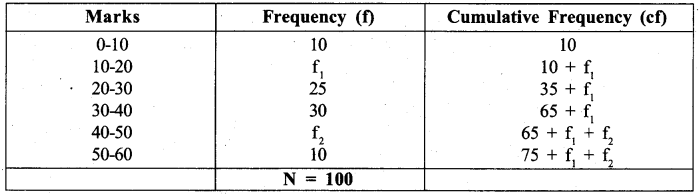
The first equation will be obtained from frequency
75 + f1 + f2 = 100 → f1 + f2 = 25
The second equation will be related to the median
Median (M) = 30, Median Class is 30-40.
Putting the value of f1 in equation (i)
f1 + f2 = 25
15 + f2 = 25
f2 = 25 – 10
Thus f1 = 15, f2 = 10.
![]()
RBSE Class 11 Economics Chapter 10 Practice Questions
Question 1.
Find out the mode from the following series :
| Item-Value | 1 | 2 | 3 | 4 | 5 | 6 |
| Frequency | 2 | 9 | 17 | 13 | 7 | 5 |
Answer:
It is clear by inspection that the highest frequency is 17 and the corresponding item value is 3. Thus Mode = 3.
Question 2.
Find out the mode from the following series :

Answer:
| Class | Frequency |
| 0-10 | 5 |
| 10-20 | 7 |
| 20-30 | f0 10 |
| l1 30-40 | f1 18 |
| 40-50 | f2 16 |
| 50-60 | 10 |
| 60-70 | 5 |
Highest Frequency =18 which lies in the Class interval (30-40)
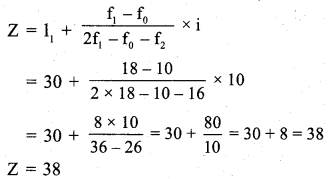
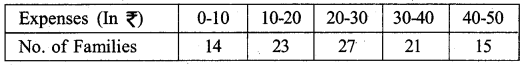
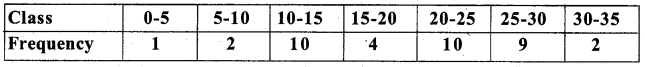
Question 3.
Find out the mode from the following series :
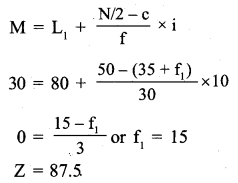
Answer:
| Class | Frequency |
| 0-10 | 14 |
| 10-20 | 23 f0 |
| l1 20-30 | 27 f1 |
| 30-40 | 21 f2 |
| 40-50 | 15 |
Highest Frequency = 27 which is in the class-interval = 20-30
![]()
Question 4.
Find out the mode from the following series :
Answer:
Grouping :
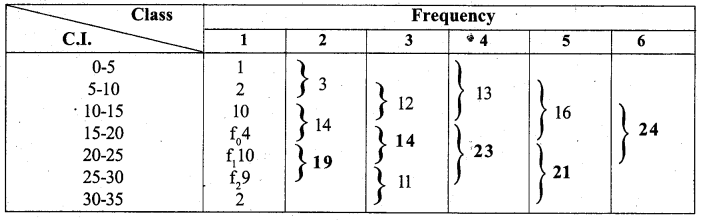
It is clear by the analytical table that mode value lies in the class-interval 20-25.
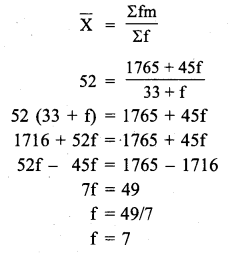
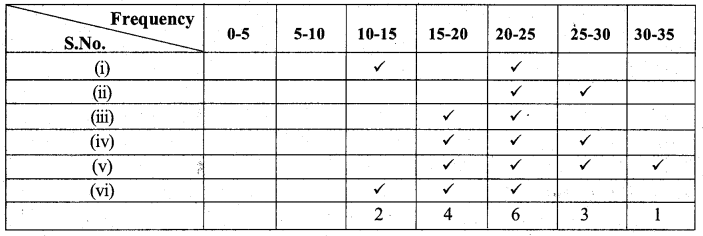
Question 5.
Find out the mode from the following table :

Answer:
The given table has unequal class intervals. The question will be solved after making the class intervals equal.
| Class | Frequency |
| 0-8 | 6 f0 |
| 8-16 | 20 f1 |
| 16-24 | 5 f2 |
| 24-32 | 14 |
| 32-40 | 8 |
| 40-80 | 12 |
Highest Frequency = 20 which is in the class interval = 8 – 16
![]()
Question 6.
Find out the arithmetic mean and median from the following data :

Answer:
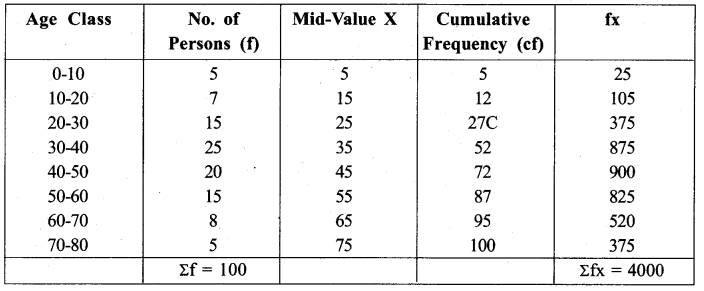
Median No. = Size of N/2th item = 100/2th item = 50th item
Size of 50th item
The size of 50th item is in the cumulative frequency 52. Its class interval is 30-40.
![]()
Question 7.
Find out the arithmetic mean, median and mode based oh the following facts :
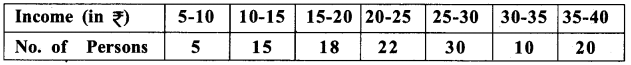
Answer:
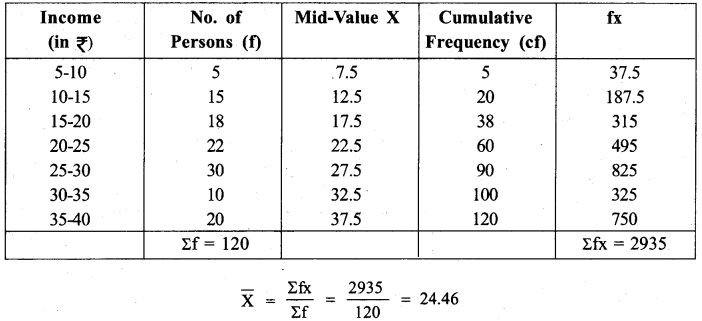
Median No. = Size of N/2th item = 120/2th item = 60th item
Size of 60th item
The size of 50th item is in the cumulative frequency 60. Its class interval is 20-25.
Calculation of Mode :
The mode class is with highest frequency 30.