Rajasthan Board RBSE Class 12 Biology Notes Chapter 38 Human Population
Human Population
Population means specific species lived in particular geographical area on a particular time.
Term Population : It is originated from Latin word populus which means people.
Population is defined ditferentely by various scientists. It can be defined as the number of living organisms that
live together in a specific place at a particular time.
Population indicates number of animals including human being lived in a specific place at a particular time.
It is of two types :
- Monospecific Population – If specific species found on a particular place than it is known as monospecfic population.
- Polyspecific Population – If there is more than one species on the same place they are called polyspecific population.
![]()
Population has its own components and structure. It is affected by many factors such as :
- Natality
- Mortality
- Immigration and Emigration
- Age
- Distribution
- Biological Ability
- Population distribution
- Biological factor reaction
Population Density
General
Population density is a measurement of population of organisms in per unit area or unit volume. Population density is numerical expression.
For Example, 100 tree per acre or 200 fishes per km or 50 billion diatoms m³.
It shows the total number of individual of specific species lived in a habitat. It can be calculated using the formula-
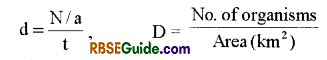
where :
d = density
N = No. of organisms
a = Area
t = Time
Population is changing from time to time i.e. it is not permanent. Change in population causes change in density.
Types of Population Density
Population Density is of two types :
Crude Density
Crude density includes all the organisms within the land range. For example if 1000 rabbit lived in 1 mile than population density will be 1000 rabbit per mile. It is calculated in per mile, per acre, or per meter. It is also known as Habitat density.
Ecological Density
Ecological density includes only that portion of land which is actually colonized by the species.
For example if 500 rabbit are lived in one mile area but they needed only ha If mile to live than ecological density will be 1000 rabbit per mile.
Determination of Population Density
Population density can be calculated by several methods, some of them are as follows-
![]()
Direct count method
- This method is used to count big size organisms which live in groups. This method is suitable for birds and big sized mammals (elephant, panther, and rabbit are counted by this method).
- In this method every individual is counted. This method showed exact population density of species. Human Population census is the best example of it. In India, human population is counted in every 10 years.
By Sampling Method.
This method is used to determine population density in ecological habitat. In this method samples have been collected from different parts and the number is counted. Average of all the samples is calculated to know the population density.
- Example 1. To calculate population of density of paramecium, Culture medium of Paramecium is shaked well and Paramecium is counted in cm5 on watch glass. Sum of result is counted and average of that is calculated in per 1 cc.
- Example 2. To calculate population density of terrestrial animals, Quadrats may be used to determine population size and density. Each quadrat marks off an area of the same size typically, a square area, within the habitat. In the end, the data can be used to estimate the population size and population density within the entire habitat. Sum of all the results is calculate and average is to be taken out. This method indicates the almost correct population density.
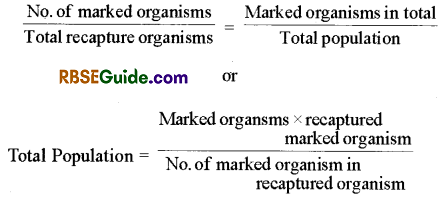
By marking and recapture Method
For organisms that move around, such as mammals, birds, or fish, rabbit, a technique mark-recapture method is often used to determine population size. This method involves capturing a sample of animals and marking them using tags, bands, paint, or other body markings. Then, the marked animals are released back into the environment and allowed to mix with the rest of the population.
Later, a new sample is collected. This new sample will include some individuals that are marked and some individuals that are unmarked. Using the ratio of marked to unmarked individuals; scientists can estimate how many individuals are in the total population.
No. of marked organisms Marked organisms in total Total recapture organisms Total population
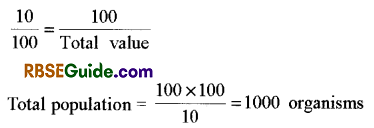
Suppose, we capture 100 organisms and release them back into the forest after marking. After some time, second sample is taken and find that 10 are already marked. We can formulate the following relationship:
![]()
By Indirect Method
In laboratory, the population density is calculated using indirect method. Such as :
- On the basis of consumption of 02, and release of C02
- On the basis of consumption quantity of food
- On the basis of remaining food material present in stomach.
- On the basis of dead animal remaining of carnivorous animals.
By sample plot method:
- In ecological habitat, this is the most simple and commonly used method.
- In this method, the area in which density is to be determine, is divided into equal plot.
- Numbers of organisms are counted in some plot and average of number is taken out.
- Average number is multiplied by total number of plots which indicate the population density of that area. ,
- For example- We have to calculate population-density in 100 km². Now 100 km² is divided into 100 plots of Km². Suppose average of 5 plots is 125 than average of 1 plot is 25. Population density of 100 Km² field is 25 x 100 => 2500.
Human Populations
General
Growth in human population takes place in geometrical ratio.
Study of trend of human population growth and prediction of culture development is called as demography.
Human population is found in all types of climates on the earth.
The growth in human population is different in different countries. The growth rate in developed countries exhibits zero or negative trend (Examples—America, France, Germany etc.). The growth rate is very high in developing countries (Examples—India, Bangla desh, China ete).
The growth rate is different in different communities of a country.
The factors which act against population growth when it reach to its maximum level are called as environmental resistance.
The size of population which remains unaltered for a long period is called its carrying capacity.
Malthus (1198) explained in his essey on “principles of population” that the ate of reproduction is very high in human beings so the population increase speedly than the available food. He explained that the population increases in geometrical ratio & the food production increases in arithmatical ratio.
Since last few decades human population is increasing in developing countries. In 1900, total population of world was 2000 million and in year 2000 it was 6000 million.
Similar growth in population is also seen in India. In 1947 our population was 350 million which is now in year 2000 increased up to 1000 million. It means every 6th person in world is an Indian.
![]()
The reason behind increase population is the lower mortality rate, (mother mortality and child mortality rate), and increase in numbers of reproductive population. However, control has been made due to birth and child development programme. In 2001, growth rate was 1.7% means out 17 person per 1000 per year. If we increase on same rate within 33 years will get double in number.
On 11 July 1987, 5 billionth child was bom and this day is called World Population Day. On August 2017 total population of world was 7500 million or 750 crores. 39.3.2 Population in India
India is second largest country in the world concern to human population. The India population was 134 crore as on Nov. 2017. Maximum population is found in China which was 141 crore on Nov., 2017.
In India, population is increasing at the rate of 1.2%. If this growth in the population continues, the India will become the country of largest human population by 2030. India harbours 17.85% of the world population.
Population in the Western countries is decreasing. On the contrary, it is increasing in India and other Asian countries.
In India, out of total puplation 69.7 crore are males and 65.2 crore are females. The sex ratio in India is 945 females per 1000 males. 50% of Indian population is in age slot of 0-25 years. 72.2% population inhabiting rural area and about 27.8% population living in arban area.
Population Growth Form.
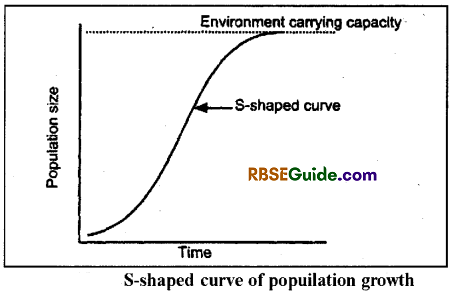
Population of either human or organisms always increases and the increase is more when the population reproduces actively. The population growths always grow in a particular manner which is called Growth Curve.
The growth curves are of two types :
- “S” Shaped Growth Curve
- “J” shaped Growth Curve
S-Shaped Growth or Sigmoid growth curve
It is also called as sigmoid curve
It has 3 phases :
- Early or Lag phase :
There is little or no growth. - Middle or Log or Exponential phase :
There is fast growth in the population. - Stationary or Zero or Plateau phase :
The population growth is zero.
The mortality and natality are equal
The population becomes equal to the environmental carrying capacity.
In S (sigmoid) form, the population increases slowly at first, then more rapidly but it soon slows down gradually as the environment resistance increases
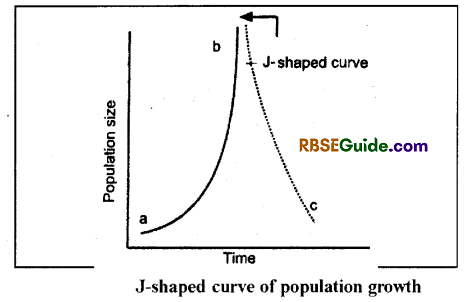
J-shaped curve
- It is J-shaped
- It is exhibited by the populations of insects & human beings.
- It is also called as bioticpotential curve.
- According to it, population grows speedly and this growth is more in large populations in comparision to small populations.
J-shaped curve has 3 phases:
- Lag or Establishment phase
- Exponential phase
- Crash phase
The human population is in it’s exponential phase. The crash phase is yet to come.
![]()
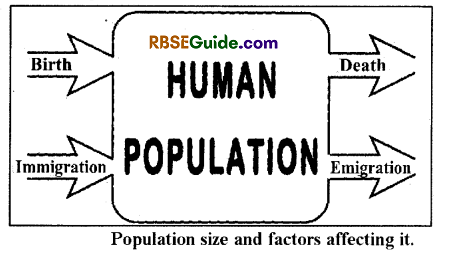
Factors affecting Population Growth
General
Population of any country is affected by 4 factors
- Natality
- Mortality
- Migration
- Age Distribution
More natality in any country and less mortality increases population and the vice versa. Similarly, if human Immigration is more than migration, the population will increase and vise versa.
Natality or Fertility
It determines the growth of any population. In a population the ability to produce new baby from active reproducing organisms, is called fertility. In a growing population natality is one of the important factor.
Brith rate is the number of births per 1000 individuals per year. It can be calcualted by following formula-

where N = Natality / Birth rate
B = Birth of children per 1000 people
t = Time period in year
Bodenhemur divided human population in 3 groups:
- Pre-reproduction population
Population below 18 years of age - Reproductive population
Population between 18 to 45 years of age - Post-reproductive population
Population above 45 years of age
More number of reproductive population indicates increase in the population growth. Similarly, more number post-reproductive population indicates decrease in the population growth.
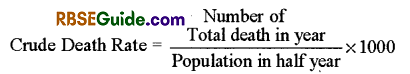
Mortality
Mortality or Death rate is the number of deaths per thousand persons in a year.

where
M = mortality,
D = Number of death in one thousand persons and
t = time in years
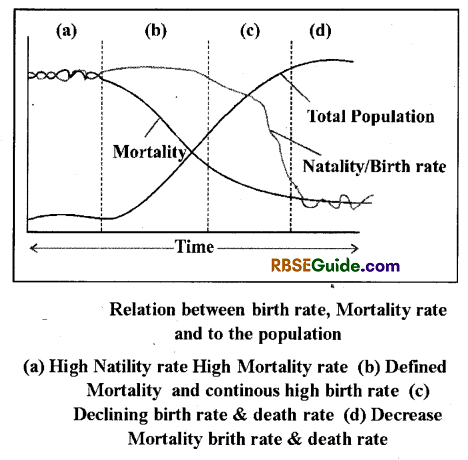
In many countries a decline in death rates is recorded which resulted into increase in population. This could be because of following reasons-
- Developed medical facility including Immunization vaccination.
- Level of cleanliness has increased.
- Awareness towards personal health & cleanliness has increased.
- Availability of food and water is in sufficient amount Mortality and Natality are the important factors which determine the population. In other words, using mortality and natality rate, population pattern of any country can be determined.
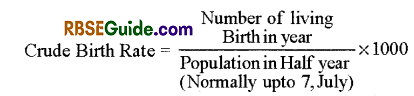
1. Crude Birth Rate :
The crude birth rate is the rate of births among a population of 1,000.
2. Crude death Rate :
It is the rate of death among a population of 1000.
3. Annual Rate of Natural Increase/Growth:
Difference between mortality and natality is called Annual growth rate.
Annual growth rate = Natality / Birth rate – Mortality rate
If mortality and natality are equal, population shape is stationary means growth rate of population will be zero. However, it occurs very rarely. It can be seen in some developed society. ‘
![]()
Migration
- The movement by humans from one area to another is known as Migration. The humans who undergo migration are called Migrants.
- The people who migrate into a territory are called immigrants, and their convey as Immigration.
- Similarily the, people who leave a territory are called Emigrants, and movement is Emigration.
- However migrations can occur in different places of same country. Only migrations between 2 countries affect the population.
- Due to Emigration population density gets decreased and due to immigration it increases. Due to migration increase in population is called Net Immigration. It can be calculated by-
- Net Immigration = Immigration – Emigration
- Net Immigration can be positive, zero or negative.
Age Distribution
General :
Age distribution is an important factor. It affects both Mortality and Natality. Distribution of various age groups in population is called Age Distribution.
Natality and Mortality varies according to age. In the similar way reproduction also depend on the age. Population growth depends on the ratio of all these factors. This ratio determine the future of any population.
On the basis of economy, the human population is divided into 2 groups:
- Dependent age group (DAG)
It includes children of 18-20 years of age which are economically dependent on their parents. - Productive age group (PAG)
The population which is capable of earning.
Ratio of DAG & PAG is called as dependency ratio (DR)
DR => Number of DAG Number of PAG
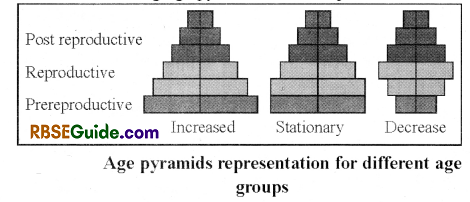
Age Pyramids
An age pyramid, is a graphical illustration that shows the distribution of various age groups in a population. Population pyramids often contain continuous stacked- histogram bars, making it a horizontal bar diagram. In ecology, 3 types of pyramid can be imagined-
(A) A pyramid with Broad Base
In this type of pyramid, base part is wide. In this types of pyramid natality rate is high and population grow rapidly. Number of organism in each generation increase from previous gengration. This types of pyramids are found in Yeast, Paramecium. house-fly.
(B) A Bell shaped Polygon
In this type of population growth rate is slow and become stationary. Pre reproductive and reproductive age groups are almost equal number. Post reproductive age groups will remain small. This type of population is bell shaped.
(C) An Urn Shaped Pyramid-groups
In this pyramid child population is very less. Birth rate becomes very lows Since post-productive are dominating, the diminishing age pyramid is um-shaped.
![]()
Factors to Control Population
General:
Increasing population in India has raised several socio economical problems. We have to control this problem otherwise our economic growth will slow down and we will face the problem of food and place. Population control can be a chived by following ways:
Increase Age of Marriage
To control population child marriage should be strictly controlled and age of female and male should be increased to 21 and 24 years respectively for marriage.
Education
Population problem can also be controlled by educating the people that poverty, scarcity of resources and low standard living are because of population explosion.
People should be made aware about the planned family & its benefits. Sex education should be included into educational system.
Natural Method
- This technique work on principle of stopping fusion of ovum and sperm. One of the method is Abstinenea is particular period. Couples avoid sexual intercourse between 10 to 17 days in which there is ovulation process.
- In this period the chance of fertilization and pregnancy is more.
- Coitus interruptus, withdrawal or pull-out method, is also a good method of birth control in which a man during sexual intercourse, withdraws his penis from a woman’s vagina prior to orgasm (ejaculation) and then directs his ejaculate (semen) away from the vagina in an effort to avoid insemination.
- Lactational amnorrhea is the temporary postnatal infertility that occurs when a woman is amenorrheic (not menstruating) and fully breastfeeding. Time period is 4 – 6 month & chance of pregnancy is zero. This technique is effective only till six month of child age.
Family Planning Welfare
Population control can effectively done by using family planning technique. It is now’ a days called as “Family Welfare”.
It involves use of contraceptives and by making the public/ families aware about the methods of conceptives that they can decide when to give birth to young and what number they want.
The various family planning methods are as follows :
Barrier Methods
(A)Condom
- In this method, the process of fertilization between sperm and ovum is restricted using physical barrier such as condom. Condoms are barriers made up of rubber or latex sheath that are used to cover penis in male and vagina in female.
- This method is used to prevent semen from entering the female vagina. The use of condoms had increased since last few years. For males, the brand “Nirodh”, condom is very popular.
- Use of condom also prevents sexually transmitted diseases such as AIDS besides preventing pregnancy.
Both male and female condom has to be discarded after use. - It can be used by individual by its own and in this way it can remain personal.
(B) Diaphragm, Garvical Cap & Vault:
Diaphram. Uterus corvix cap, vault, rings etc. are other contraceptives made of rubber and which are put into female reprdouctive tract to cover Uterus cervix and they stop entry of sperm into female tract.
(C) Spermicidal
Spermicidal ceram. jelly and foam are also used as contraceptive measure.
Intra Uterine Device (ILID)
Intra-uterine devices are small devices that are inserted into the uterus by doctors.
Examples :
- Non-Medicated IUD—Lippes Loop.
- Copper Releasing IUD-CuT, Cu7, Multiload 375 etc.
- Hormone Releasing IUD-LNG 20, Progestart etc.
![]()
These devices promote phagocytosis of sperms to prevent fertilization. They are used to delay the pregnancy. CuT, Cu7 are devices containing copper. The release of copper ions inhibits the motility of sperms & fertilisation. These are considered as ideal contraceptives for females. TIT) hormones prevent implantation in the uterus two children, IUD is an idial method. It is widely used in India.
Contraceptive Pills
These Pills are used as oral contraceptives. These pills contain small doses of estrogen or progesterone or a combination of both. These oral contraceptives should be taken for a period of 21 days. After a gap of 7 days, that is, at the time of menstruation, these pills should be avoided.
After this gap, these pills should be taken again in the same pattern until and unless female desires conception or fertilization. Progesterone or combination with estrogen may also be given to females via injections. They work similar to orally taken pills.
Saheli is a new oral contraceptive without any steroids hormone. It contains a chemical called centchroman. It is higly effective contraceptive pill.
Emergency pills Contain a chemical called Levenorgastril. This pill is to be taken after forced sex or unplanned sex within 72 hours. It prevents ovulation. It is also called as pill-72
Surgical methods.
Surgical methods are also being used to control birth. These methods are also known as Sterilization methods. These methods are used to terminate any further pregnancy. These methods block gamete transfer and thus prevent conception. They are two types :
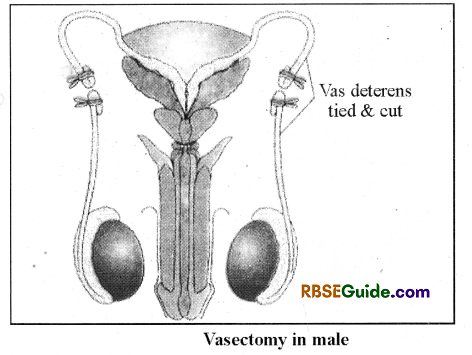
(A) Vasectomy
Vasectomy is one of the methods used in males. In this method, a small incision is made and vasdeferens get tied.
It is commonly known as “Male Nasbandi”.
![]()
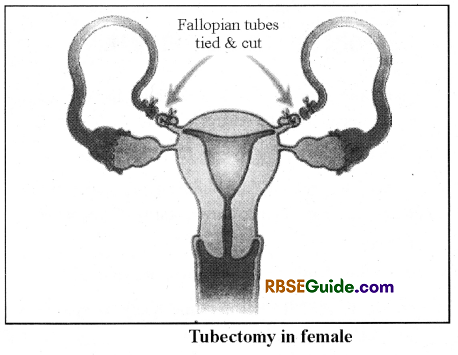
(B) Tubectomy :
Similarly, in females Tubectomy is done. In tubectomy, a small part of Fallopian tube is removed via incision or it get tied.
This techniques are effective and have reversibility. This techniques are commonly known as “female Nasbandhi”.