A graph in Fig. shows the change in position with time for two objects A and B moving. Class 9
A graph in Fig. shows the change in position with time for two objects A and B moving. Class 9
Question 1.
A graph in Fig. shows the change in position with time for two objects A and B moving in a straight line from 0 to 10 seconds. Choose the correct option(s). Class 9
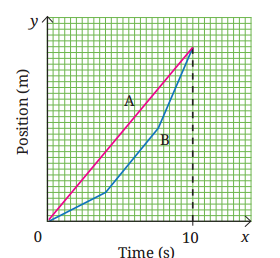
(i) The average velocity of both over the 10 s time interval is equal since they have the same initial and final positions.
(ii) The average speeds of both over the 10 s time interval are equal since both cover equal distance in equal time.
(iii)The average speed of A over the 10 s time interval is lower than that of B since it covers a shorter distance than B in 10 seconds.
(iv)The average speed of A over the 10 s time interval is greater than that of B since B’s speed is lower than A’s in some segments.
Answer:
(i) Since both A and B start at the same position and end at the same position after 10 s, their displacement is the same. Average velocity = displacement / time, and since displacement and time are the same for both, their average velocities are equal. This statement is TRUE.
(ii) Average speed = total distance travelled / time. The total distance covered depends on the actual path length, not just the start and end positions. A (curved graph) has travelled more total distance during its motion than B (it moved faster earlier and covered more ground). So their average speeds are NOT necessarily equal. This statement is FALSE.
(iii)Object A (curved line) covers more total path length than B during the 10 s interval - it moves fast in the first half and slower later, but overall covers more distance. Object B covers less total distance. Therefore, the average speed of A is greater than (not lower than) that of B. This statement is FALSE.
(iv)The average speed of A over the 10 s interval is greater than that of B, because A covers more total distance than B over the same 10 s. This statement is TRUE.
Correct answers: (i) and (iv)