Activity 4.3 Let us plot a position-time graph for a uniformity moving vehicle using data. Class 9
R
RBSEGuide
Activity 4.3 Let us plot a position-time graph for a uniformity moving vehicle using data. Class 9
Activity 4.3 Let us plot a graph
Aim: To plot a position-time graph for a uniformity moving vehicle using data from a table, and learn how to read and interpret such graphs.
Observation:
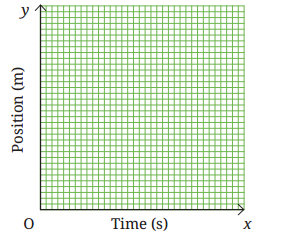
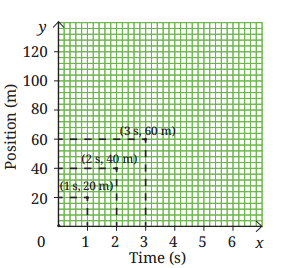
This activity guides you the process of visualising motion by plotting a position-time graph. Marking origin, x and y axis on graph paper, than plotting points on the graph. All points lie exactly on a straight line passing through the origin as in fig. (a).
Conclusion:
A straight line on a position—time graph = uniform motion = constant velocity.
The slope of the line = velocity = 20 m/1s = 20 ms-1