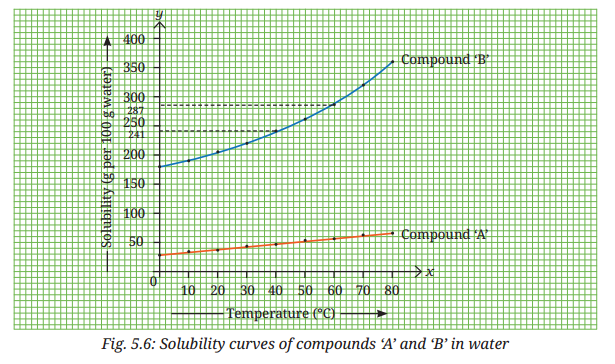
Activity 5.2 Let Us Represent Solubility Graphically curves of compounds A and D. Class 9
R
RBSEGuide
Activity 5.2 Let Us Represent Solubility Graphically curves of compounds A and D. Class 9
Activity 5.2 Let Us Represent Solubility Graphically
Aim: To study the solubility curves of compounds A and D.
Procedure:
- Take 100 g of water in a beaker.
- Add a solute (e.g., salt or potassium nitrate) and stir until no more dissolves (saturated solution).
- Note the temperature and amount of solute dissolved.
- Repeat the experiment at different temperatures (e.g., 20°C, 30°C, 40°C, etc.).
- Record all values in a table.
- Plot a graph:
X-axis → Temperature (°C)
Y-axis → Solubility (g per 100 g water)
Observation:
- As temperature increases, the solubility of most solids increases.
- The graph usually shows a rising curve.