Draw a graph to represent a sound wave for which the density amplitude. Class 9
R
RBSEGuide
Draw a graph to represent a sound wave for which the density amplitude. Class 9
Question 1.
Draw a graph to represent a sound wave for which the density amplitude is 3 units and wavelength is 4 cm. Class 9
Answer:
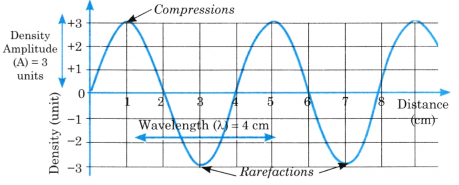
- X-axis: Distance (in cm)
- Y-axis: Density
- A horizontal dashed line at average density (e.g., at the middle).
A sinusoidal curve where:
- The maximum density (crest) is 3 units above the average density line.
- The minimum density (trough) is 3 units below the average density line.
- The distance between two consecutive crests (or troughs) = 4 cm (the wavelength).
- Mark compressions (C) at crests and rarefactions (R) at troughs.