Graphs representing two sound waves are given in Fig. If the scales on the X and Y axes. Class 9
R
RBSEGuide
Graphs representing two sound waves are given in Fig. If the scales on the X and Y axes. Class 9
Question 1.
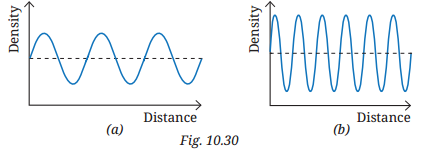
Graphs representing two sound waves are given in Fig. If the scales on the X and Y axes of the two graphs are the same, which of the two sound waves has (i) greater wavelength, and (ii) smaller amplitude? Class 9
Answer:
Looking at the two graphs (a) and (b) in Fig. with the same scale:
(i) Greater wavelength: Graph (a) - The distance between consecutive crests (or troughs) is larger in graph (a), indicating a longer wavelength.
(ii) Smaller amplitude: Graph (b) - The maximum change in density (height of crests) is smaller in Graph (b), indicating a smaller amplitude.