Plot a graph between the age of a tree (in years) on the x-axis and the diameter. Class 9
Plot a graph between the age of a tree (in years) on the x-axis and the diameter. Class 9
Question 1.
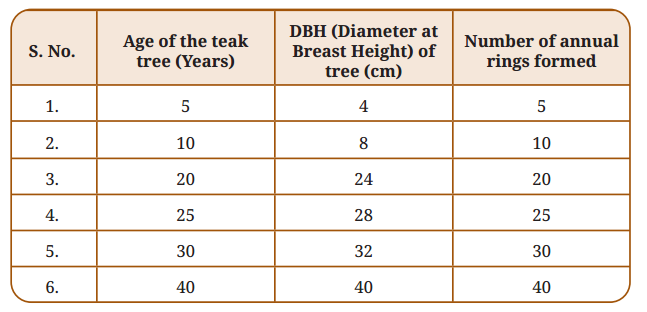
Plot a graph between the age of a tree (in years) on the x-axis and the diameter of the tree (in cm) along with the number of annual rings formed over time on the y-axis, using the data given in the Table. Class 9
Answer:
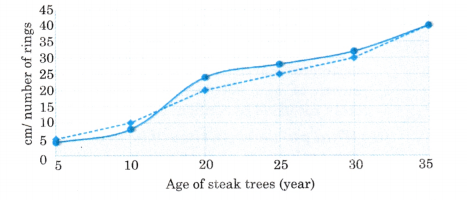
(i) Analyse the graph in terms of the diameter of the stem over time and share the interpretation.
Answer:
Graph Analysis: The diameter of the stem increases steadily with age. From age 5 to 10 years, growth is gradual (4 to 8 cm). Between 10 and 20 years, there is a rapid increase (8 to 24 cm). After 20 years, growth continues but at a more moderate rate. This shows that the tree grows in girth most rapidly in its younger years, then the rate of growth gradually stabilises. The diameter increases continuously as long as the tree is alive.
(ii) What is the relation between the diameter of the teak tree to the annual rings formed?
Answer:
Relation between diameter and annual rings: The number of annual rings equals the age of the tree in years (e.g., 5 years = 5 rings, 40 years = 40 rings). Each year, one new ring is formed. The diameter at breast height (DBH) also increases with age. So, both increase with age - but not in the same proportion. Diameter growth is rapid in early years then slows. This means annuah rings are not all equal in thickness - early rings may be wider (more growth) and later rings may be narrower.
(iii) Which specialised tissue is responsible for the girth of the stem and where is it located?
Answer:
The specialised tissue responsible for girth (increase in diameter/thickness of stem) is the lateral meristem. It is located along the circumference (periphery) of the stem, arranged in a ring. Cells of the lateral meristem divide and add new cells inward and outward in a concentric manner, causing the stem to become thicker over time.