The acceleration mass graph for the acceleration produced by a force on objects. Class 9
R
RBSEGuide
The acceleration mass graph for the acceleration produced by a force on objects. Class 9
Question 1.
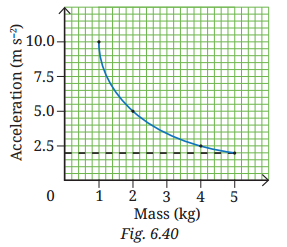
The acceleration-mass graph for the acceleration produced by a force on objects of different masses is plotted in Fig. Plot the force-mass graph for this case. Class 9
Answer:
From Newton's second law: F = ma.
The acceleration-mass graph in fig. shows a hyperbolic curve (a = F/m - inversely proportional relationship for constant F), confirming that the same force is applied throughout.
| Mass (kg) | Acceleration (m/s2) | Force = ma (N) |
| 1 | 10.0 | 10 |
| 2 | 5.0 | 10 |
| 4 | 2.5 | 10 |
| 5 | 2.0 | 10 |
| 10 | 1.0 | 10 |
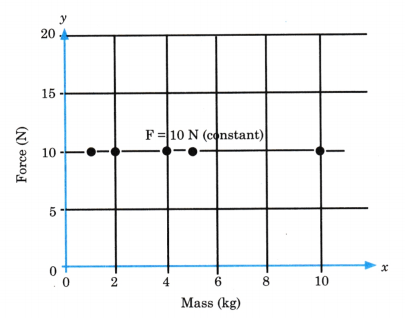
For the force-mass graph: Since F = ma and F is constant (the same force is applied on objects of different masses), the force does not change regardless of mass.
Therefore, the force-mass graph will be a horizontal straight line (parallel to the mass axis) at the constant value of F.