The position time graph of two objects A and B are given below. Class 9
The position time graph of two objects A and B are given below. Class 9
Question 1.
The position time graph of two objects A and B are given below. Which object has higher average velocity?
Answer:
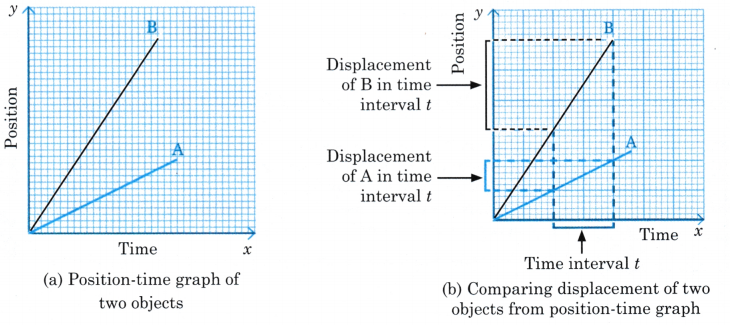
By making lines parallel to axis, it is noticed that displacement of object B is more than object A for same time interval. Thus, velocity of object B is more than object A. Slope for B is higher than A.
- When velocity is constant, the velocity time graph is straight line parallel to x axis and acceleration is zero.
- Straight line velocity time graph below indicates that velocity is increasing with constant acceleration in direction of velocity.
- Straight line velocity time graph below indicates that velocity is decreasing with constant acceleration opposite to direction of velocity.
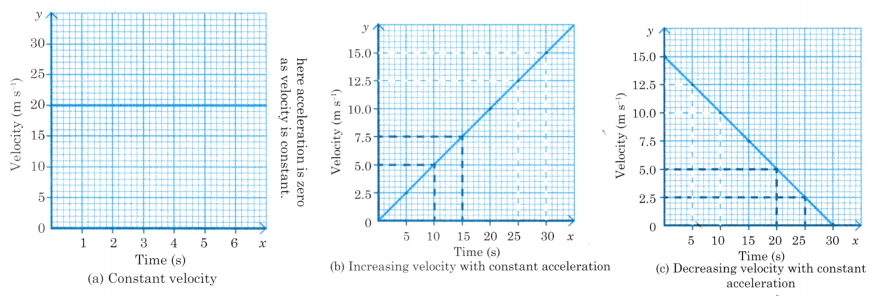
It can be used to calculate the acceleration of object.
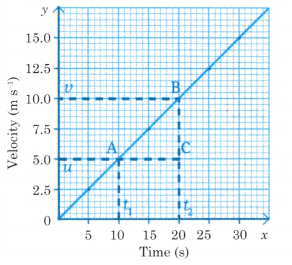
a = [latex]\frac{\mathrm{v}-\mathrm{u}}{\mathrm{t}_2-\mathrm{t}_1}=\frac{\mathrm{BC}}{\mathrm{CA}}=\frac{10-5}{20-10}[/latex] = 0.5 m/s²
To calculate displacement from v-t graph, we need to find Area under slope.
Area enclosed by velocity time graph = displacement.
OA = velocity and OC = time interval
Area of rectangle OABC = OA × OC = velocity x time interval = displacement
Displacement between 0 to 6 s = area of OABC = 20 × 6 = 120 m