The sound waves emitted by three sources A, B and C are represented in Fig. Class 9
R
RBSEGuide
The sound waves emitted by three sources A, B and C are represented in Fig. Class 9
Question 1.
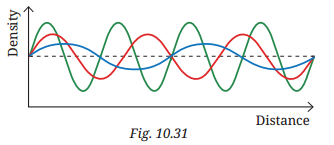
The sound waves emitted by three sources A, B and C are represented in Fig. If the frequency of A is maximum and C is minimum, identify the corresponding curves, and mark A, B and C on them. Class 9
Answer:
Frequency is inversely related to wavelength (v = λv, speed is constant).
- Higher frequency → shorter wavelength (more crests per unit distance).
- Lower frequency → longer wavelength (fewer crests per unit distance).
From above given Fig. (three overlapping curves):
- A (maximum frequency) → the curve with the shortest wavelength (most closely spaced crests).
- C (minimum frequency) → the curve with the longest wavelength (most widely spaced crests).
- B → the curve with wavelength between A and C.