Data Handling and Presentation Class 6 MCQ
easyData Handling and Presentation Class 6 MCQ
Data Handling and Presentation Class 6 MCQ
Question 1.
A teacher wants to know the favourite ice-cream flavor of his students. How should the teacher record the data to know the number of students whose favourite flavour is chocolate?
(а) List of students and their choice of flavour written against each name.
(b) Write the number of students who prefer each flavour.
(c) List of students whose favourite flavour is chocolate.
(d) Writing the flavours preferred one by one.
Answer:
(b) Write the number of students who prefer each flavour.
Question 2.
A bakery owner wants to record the sale of four items over the past hour. The owner thinks of two ways to record the data as shown.
Method I: Recording the number of each item sold.
Method II: Taking 4 jars and putting a coin for each item sold.
Which of these methods is correct?
(a) The only method I
(b) Only method II
(c) Both method I and method II
(d) Neither method I nor method II
Answer:
(c) Both method I and method II
Question 3.
The given pictograph shows the number of books sold at a bookshop over a week.
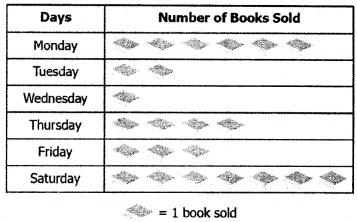
On which day was the minimum number of books sold?
(a) Saturday
(b) Tuesday
(c) Monday
(d) Wednesday
Answer:
(d) Wednesday
Question 4.
The pictograph shows the number of bouquets sold by a flower shop in the past 4 days.
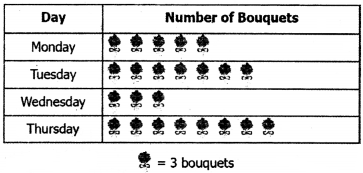
What is the difference between the greatest number of bouquets sold and the least number of bouquets sold?
(a) 5
(b) 9
(c) 15
(d) 33
Answer:
(d) 33
Question 5.
A group of students was asked about their favourite instrument. The teacher represents the information in the pictograph shown.
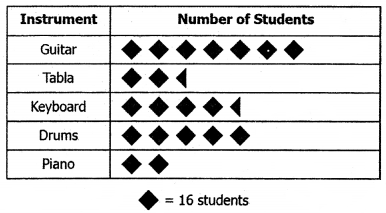
The teacher makes a mistake while representing the information:
- More students prefer the piano to the tabla
- Less number of students prefer Keyboard than Tabla
If the total number of students showing preference for the 3 instruments remains the same, which of these could be the number of students who prefer Piano, Tabla, and Keyboard?
(a) Piano = 4, Tabla = 3 and Keyboard = 2
(b) Piano = 64, Tabla = 48 and Keyboard = 32
(c) Piano = 48, Tabla = 64 and Keyboard = 32
(d) Piano = 68, Tabla = 48 and Keyboard = 36
Answer:
(b) Piano = 64, Tabla = 48 and Keyboard = 32
Question 6.
The given bdr graph shows the number of fruits sold by the fruit vendor in the last two weeks.
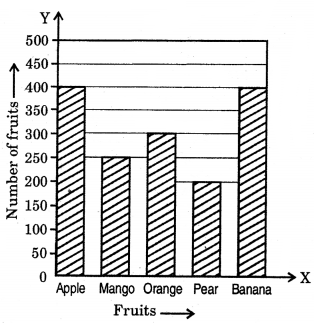
How many more apples were sold than mangoes in the last two weeks?
(a) 150
(b) 250
(c) 400
(d) 650
Answer:
(a) 150
Question 7.
The bar graph shows the sales of candles at a fair in the last six weeks.
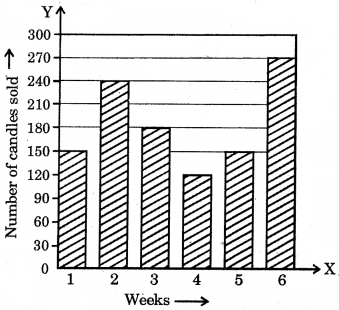
Which of these statements is correct?
(a) In an odd number of weeks, 150 fewer candles were sold than in an even number of weeks.
(b) In the first three weeks, 20 more candles were sold than in the last three weeks.
(c) In week 1,120 more candles were sold than in week 6.
(d) A total of 1010 candles were sold in 6 weeks.
Answer:
(a) In an odd number of weeks, 150 fewer candles were sold than in an even number of weeks.
Question 8.
A bakery owner records the sales of its items over an hour as shown below.
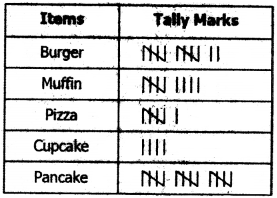
After 2 hours, the bakery sold a total of 74 items, with the highest number of muffins being sold, and the least number of pizzas was sold. Which of the following tables represents the data after 2 hours?
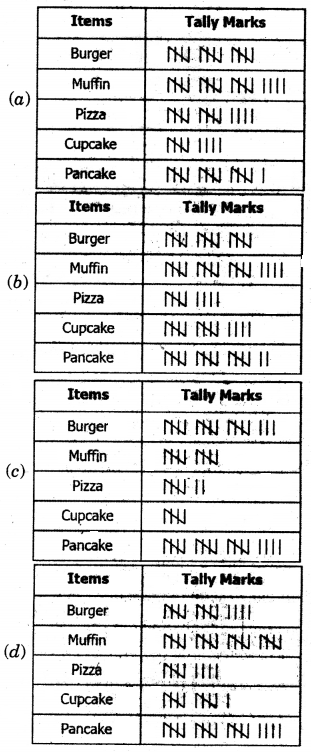
Answer:
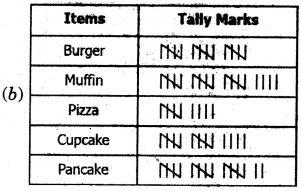
Question 9.
The tally chart below displays the heights, in cm, of a group of students.
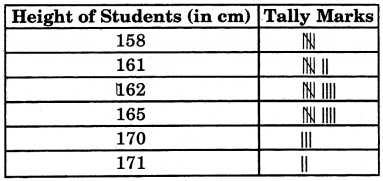
How many students have a height between 160 cm and 166 cm?
(a) 34
(b) 25
(c) 24
(d) 29
Answer:
(b) 25
Question 10.
The bar graph below displays the average salary of employees based on their departments:
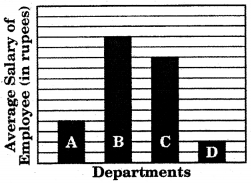
If the difference in the average salary of an employee in Department B and Department D is ₹ 40,000, what must be the scale of the bar graph?
(a) 1 unit = ₹ 100
(b) 1 unit = ₹ 400
(c) 1 unit = ₹ 1000
(d) 1 unit = ₹ 4000
Answer:
(d) 1 unit = ₹ 4000
Case Study
I. The bar graph below depicts the number of students studying in different classes of a Primary School.
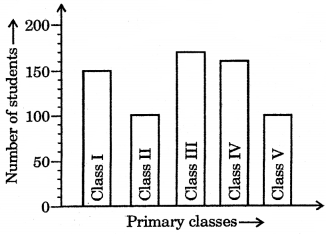
Question 1.
The total number of students in all the classes is
(a) 700
(b) 680
(c) 650
(d) 640
Answer:
(b) 680
Question 2.
The difference in the number of students between classes IV and II is
(a) 20
(b) 60
(c) 40
(d) 80
Answer:
(b) 60
Question 3.
The sum of the number of students in classes 2, 3, and 5 is
(a) 380
(b) 375
(c) 370
(d) 368
Answer:
(c) 370
Question 4.
The difference in the number of students between classes 3 and 2 is
(a) 68
(b) 70
(c) 73
(d) 75
Answer:
(b) 70
Question 5.
The difference in the number of students between classes 1 and 5 is
(a) 45
(b) 47
(c) 48
(d) 50
Answer:
(d) 50
II. Savings of Students
A bar graph was drawn by a group of five students of class VI on the blackboard, depicting their savings from their monthly pocket money as shown below:
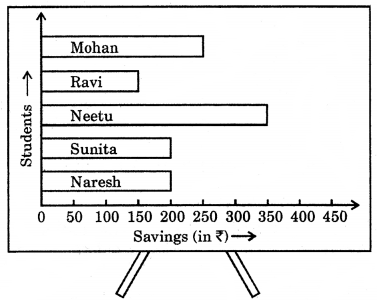
Question 1.
How much money does Neetu need to save to have twice the money that Naresh has?
(a) ₹ 200
(b) ₹ 150
(c) ₹ 100
(d) ₹ 50
Answer:
(d) ₹ 50
Question 2.
Total money saved by the whole group is
(a) ₹ 800
(b) ₹ 950
(c) ₹ 1150
(d) ₹ 1100
Answer:
(c) ₹ 1150
Question 3.
The difference in money saved by Neetu and Sunita is
(a) ₹ 300
(b) ₹ 250
(c) ₹ 200
(d) ₹ 150
Answer:
(d) ₹ 150
Question 4.
The sum of the money saved by Ravi, Neetu, and Naresh is
(a) ₹ 800
(b) ₹ 750
(c) ₹ 700
(d) ₹ 650
Answer:
(c) ₹ 700
Question 5.
The difference in the money saved by Mohan and Sunita is
(a) ₹ 60
(b) ₹ 50
(c) ₹ 40
(d) ₹ 30
Answer:
(b) ₹ 50