Estimate and then measure the objects listed in the following table. Class 7
mediumEstimate and then measure the objects listed in the following table. Class 7
Question 1.
Estimate and then measure the objects listed in the following table. Draw a double bar graph based on the data. How accurate were your estimates? Find the average difference between the estimated and measured values. Class 7
| Object | Estimate (in cm) | Measure (in cm) | Positive Difference |
| Length of a pen | |||
| Length of an eraser | |||
| Length of your plam | |||
| Length of your geometry box | |||
| Length of your math notebook |
Solution:
Do as directed and fill the table and also find the average :
| Object | Estimate (in cm) | Measure (in cm) | Positive Difference |
| Length of a pen | 12 cm | 12 cm | __ |
| Length of an eraser | 6 cm | 5 cm | 1 cm |
| Length of your plam | 8 cm | __ | __ |
| Length of your geometry box | 16 cm | __ | __ |
| Length of your math notebook | 32 cm | __ | __ |
Question 2.
Aditi likes solving puzzles. She recently started attempting the ‘Easy’ level Sudoku puzzles. The time she took (in seconds) to solve these puzzles are — 410,400,370,340,360, 400, 320, 330, 310, 320, 290, 380, 280, 270, 230, 220, 240. The first nine values correspond to Week 1 and the rest to Week 2. Class 7
(a) Construct a dot plot below showing the data for both weeks.
(b) Describe the mean, median, and any observations you may have about the data.

Solution:
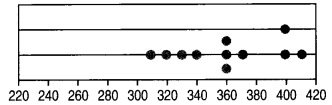
Mean = 360
Median = 360
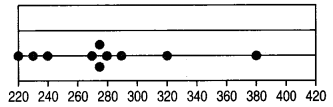
Mean = 279 (approx)
Median = [latex]\frac {270+280}{2}[/latex] = 275