Spend sufficient time observing the data presented in this table. Class 7
hardSpend sufficient time observing the data presented in this table. Class 7
Question 1.
Spend sufficient time observing the data presented in this table. Class 7
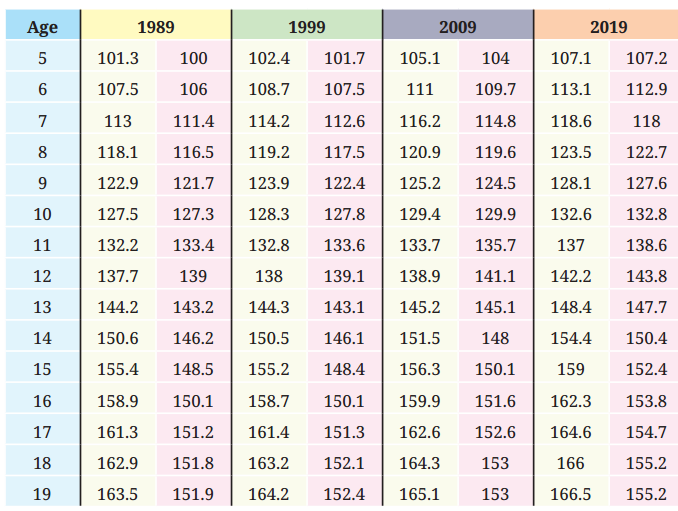
Share your findings with the class.
Solution:
Do as directed.
These are some prompts for you to probe —
- Changes in the heights of boys or girls of a certain age from 1989 to 2019.
- The heights of boys vs. girls at different ages in a particular year.
- Changes in height between successive ages in boys and girls in 2019.
Solution:
- Heights of boys or girls of a certain age has a little increase from 1989 to 2019.
- In a particular year, heights of boys are generally more than that of girls.
- Changes in heights between successive ages in boys and girls in 2019 are on the increasing side, in general.
Question 2.
Which of the following statements can be justified using the data? Class 7
1. The average heights of both boys and girls at every age increased from 1989 to 2019.
2. The average height of 13-year-old girls in 1989 is More than the average height of 14-year-old girls in 2009.
3. The average height of 15-year-old boys in 2019 is more than the average height of 16-year-old boys in 1989.
4. All girls aged 13 are taller than all girls aged 11.
5. Throughout the age period 5 to 19, the average boy’s height is more than the average girl’s height.
6. Boys keep growing even beyond age 19.
Solution:
1. Yes
2. No
3. Yes
4. Yes
5. Yes
6. Yes.
Question 3.
In 2019, between which two successive ages from 5 to 19 did boys grow the most? Between which two successive ages from 5 to 19 did girls grow most? Class 7
Solution:
Boys : 13 and 14 years. Girls : 11 and 12 years.
Question 4.
Suppose the average height of a newborn is 50 cm. Estimate the average height of young children of ages 1 to 4. Class 7
Solution:
Do as directed, say 90 cm.
Question 5.
Based on the trend observed in the table, write your estimates of the heights of boys and girls for ages 5 to 19 in the year 2029. Class 7
Solution:
Do as directed.