The following clustered-bar graph shows the number of electric. Class 7
mediumThe following clustered-bar graph shows the number of electric. Class 7
Question 1.
The following clustered-bar graph shows the number of electric vehicles registered in some states every year from 2022 to 2024. Class 7
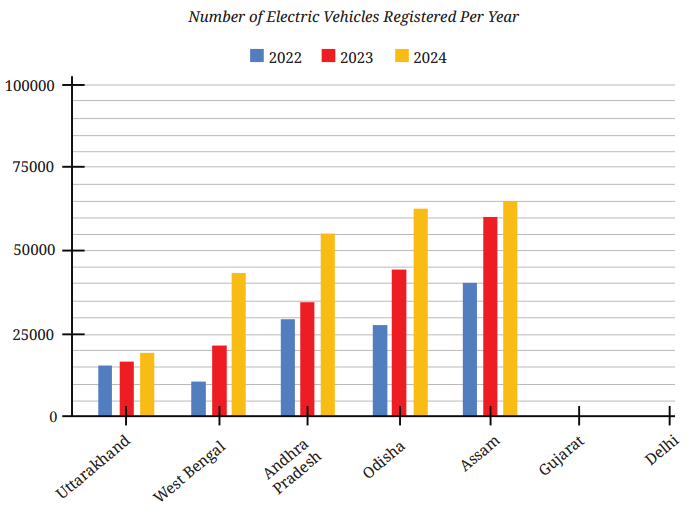
(a) The data (rounded-off to thousands) for the states of Gujarat and Delhi are given in the table below. Mark the corresponding bars on the bar graph. (It is enough if you place the top of the bars between the two appropriate vertical guidelines.)
| 2022 | 2023 | 2024 | |
| Gujarat | 69000 | 89000 | 78000 |
| Delhi | 62000 | 74000 | 81000 |
(b) Notice how the graph is organised, what scale is used, and what patterns the data shows.
(c) How would you describe the change for various states between 2022 and 2024?
(d) Approximately how many more registrations did Assam get in 2023 compared to 2022?
(e) How many times more did the registrations in West Bengal increase from 2022 to 2024?
(f) Is this statement correct — ‘There were very few new registrations in Uttarakhand in 2023 and 2024, as the increase in the bar lengths is minimal’?
Solution:
(a) Bars have been drawn in the bar graph above.
(b) Three bars have been drawn for each year and the use of scale is 1 unit = 5000 vehicles.
(c) In every state, except Gujarat, the number of registered vehicles are increasing from 2022 to 2024.
(d) Assam has approximately (65000 - 40000) = 25000 vehicles more vehicles registered in 2023 compared to 2022.
(e) In West Bengal, number of registration were increased from 10000 to about 45000 from 2022 to 2024, i.e., it has increased by 3[latex]\frac {1}{2}[/latex] times of 10000.
(f) Yes.