Connecting the Dots Class 7 Long Question Answer
hardConnecting the Dots Class 7 Long Question Answer
Connecting the Dots Class 7 Long Question Answer
Question 1.
The rainfall (in mm) in a city on 7 days of a certain week was recorded as follows:
| Day | Mon | Tue | Wed | Thu | Fri | Sat | Sun |
| Rainfall (in mm) | 0.0 | 12.2 | 2.1 | 0.0 | 20.5 | 5.5 | 1.0 |
(i) Find the range of the rainfall in the above data.
Solution:
Arranging the rainfall during the week in the ascending order, we have :
0.0, 0.0, 1.0, 2.1, 5.5, 12.2, 20.5
Range = 20.5 - 0.0 = 20.5 mm.
(ii) Find the mean rainfall for the week.
Solution:
Sum of the rainfall during the week
= 0.0 + 0.0 + 1.0 + 2.1 + 5.5 + 12.2 + 20.5
= 41.3 mm
Mean = [latex]\frac {41.3}{7}[/latex] = 5.9 mm.
(iii) On how many days was the rainfall less than the mean rainfall ?
Solution:
For five days, the rainfall was less than the mean rainfall.
Question 2.
Consider this data collected from a survey of a colony.
| Favourite Sport | Cricket | Basket Ball | Swimming | Hockey | Athletics |
| Watching | 1240 | 470 | 510 | 430 | 250 |
| Pariticipating | 620 | 320 | 320 | 250 | 105 |
(i) Draw a double bar graph choosing an appropriate scale.
What do you infer from the bar graph ?
(ii) Which sport is most popular ?
(iii) Which is more preferred, watching or participating in sports ?
Solution:
The graph is as under :
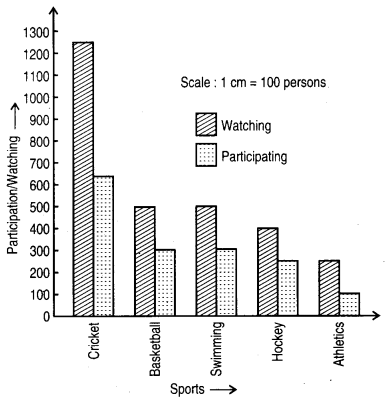
(i) It is inferred that more people prefer cricket and less athletics.
(ii) Most popular sport is cricket.
(iii) Watching is more preferred than participating.