Pooja collected data on the number of tickets sold at the Bhopal railway station for a few different cities Class 6
mediumPooja collected data on the number of tickets sold at the Bhopal railway station for a few different cities Class 6
Question 1.
Pooja collected data on the number of tickets sold at the Bhopal railway station for a few different cities of Madhya Pradesh over a 2-hour period. Class 6

She used this data and prepared a bar graph on the board to discuss the data with her students, but someone erased a portion of the graph.
(а) Write the number of tickets sold for Vidisha above the bar.
(b) Write the number of tickets sold for Jabalpur above the bar.
(c) The bar for Vidisha is 6 unit lengths and the bar for Jabalpur is 5 unit lengths. What is the scale for this graph?
(d) Draw the correct bar for Sagar.
(e) Add the scale of the bar graph placing the correct numbers on the vertical axis.
(f) Are the bars for Seoni and Indore correct in this graph? If not, draw the correct bar(s).
Solution:
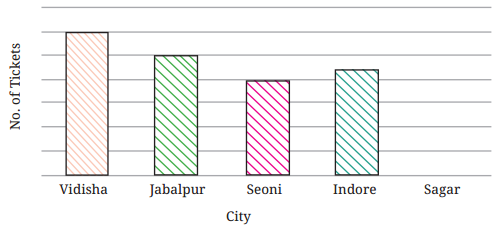
(a) 24 is written above the bar.
(b) 20 is written above the bar.
(c) Here, scale is 1 unit length = [latex]\frac{24}{6}[/latex] = [latex]\frac{20}{5}[/latex] = 4 tickets.
(d) Bar has been drawn in the graph.
(e) Scale 1 unit length = 4 tickets has been written on the graph and correct numbers have been placed on the vertical axis.
(f) Bar for Seoni is correct but bar for Indore is not correct. It has been correct as shown in the above graph.