Tales by Dots and Lines Class 8 Long Question Answer
mediumTales by Dots and Lines Class 8 Long Question Answer
Tales by Dots and Lines Class 8 Long Question Answer
Question 1.
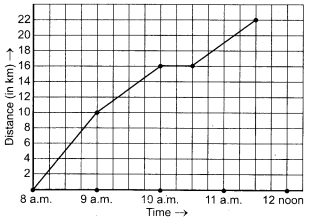
A courier-person cycles from a town to a neighbouring suburban area to deliver a parcel to a merchant. His distance from the town at different times is shown by the following graph :
(a) What is the scale taken for the time axis ?
(b) How much time did the person take for the travel ?
(c) How far is the place of the merchant from the town ?
(d) Did the person stop on his way ? Explain.
(e) During which period did he ride fastest ?
Solution:
In the graph, we find that the time is represented on the x-axis and the distance (in km) is represented on the y-axis. The distance at any time can be read from the graph exactly in the same way as we read the coordinates of a point. From the graph, we observe that :
(a) The scale taken for the time axis is : 4 units = 1 hour.
(b) The person took 3[latex]\frac{1}{2}[/latex] hours for the travel.
(c) The merchant’s place from the town is 22 km.
(d) Yes; this is indicated by the horizontal part of the graph (10 a.m. - 10.30 a.m.)
(e) Between 8 a.m. and 9 a.m. he ride fastest.
Question 2.
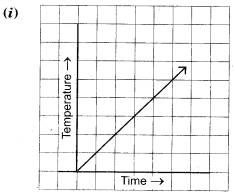
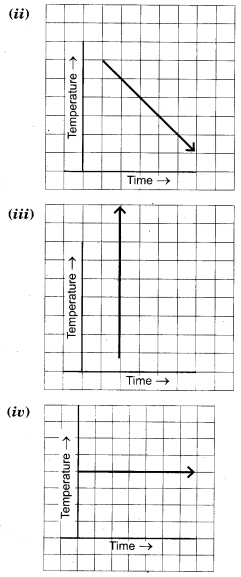
Can there be a time-temperature graph as follows? Justify your answer.
 Solution:
(i) This represents a time-temperature graph, because it represents a smooth rise in temperature and is represented by a line graph.
(ii) This represents a time-temeprature graph, because it represent a smooth fall in temeprature and is represented by a line graph.
(iii) This does not represent a time- temperature graph, because it shows different temperatures at the same time.
(iv) This represents a time-temperature graph, because it shows a constant temperature at different times and is a line graph.