The average number of customers visiting a shop and the average number of customers actually purchasing Class 8
mediumThe average number of customers visiting a shop and the average number of customers actually purchasing Class 8
Question 1.
The average number of customers visiting a shop and the average number of customers actually purchasing items over different days of the week is shown in the table below. Visualise this data on a line graph. Class 8

Solution:
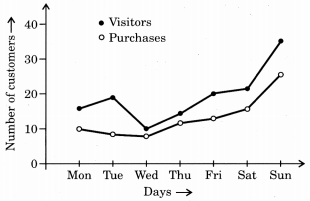
Question 2.
The average number of days of rainfall in each month for a few cities is shown in the table below : Class 8
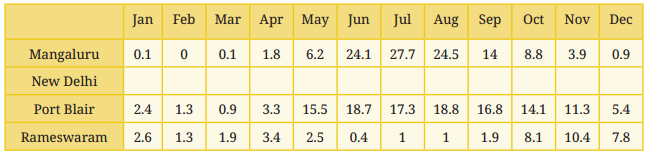
(i) What could be the possible method to compile this data?
(ii) Mark the data for Mangaluru, Port Blair, and Rameswaram in the line graph shown below. You can round off the values to the nearest integer.
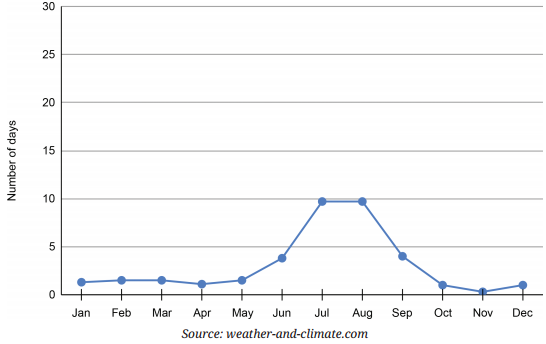
(iii) Based on the line for New Delhi in the graph fill the data in the table.
(iv) Which city among these receives the most number of days of rainfall per year? Which city gets the least number of days of rainfall per year?
(v) Looking at the table, when is the rainy season in New Delhi and Rameswaram?
Solution:
(i) Rainfalls for a particular month say January is recorded for few years and then its average is taken by dividing the total rainfall by the number of years considered for recording.
(ii) Do as directed and draw graph as done on the map for three cities.
(iii) Table has been filled above.
(iv) Rainy season is in July and August in New Delhi and it is October, November and December in Rameshwaram.