Prepare a pie chart that shows the favourite subjects of the students in your class. You can collect the data of the number of students Class 8
easyPrepare a pie chart that shows the favourite subjects of the students in your class. You can collect the data of the number of students Class 8
Question 1.
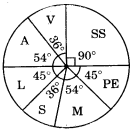
Prepare a pie chart that shows the favourite subjects of the students in your class. You can collect the data of the number of students for each subject shown in the table (each student should choose only one subject). Then write these numbers in the table and construct a pie chart: Class 8

Solution:
| Subject | Number of Students |
| Language(L) | 5 |
| Arts Education (A) | 6 |
| Vocational Education (V) | 4 |
| Social Science (SS) | 10 |
| Physical Education (PE) | 5 |
| Maths (M) | 6 |
| Science (S) | 4 |
Do as directed for the above. First find corresponding angle for each subject, which are [latex]\frac{360^{\circ}}{40}[/latex] × 5 = 45° for L, [latex]\frac{360^{\circ}}{40}[/latex] × 6 = 54° for A,
[latex]\frac{360^{\circ}}{40}[/latex] × 4 = 36° for V, [latex]\frac{360^{\circ}}{40}[/latex] × 10 = 90° for SS,
[latex]\frac{360^{\circ}}{40}[/latex] × 5 = 45° for PE, 54° for M and 36° for S.
Pie chart is shown below :
Question 2.
Can we represent this problem with the following statement of proportionality — 30 : 60 : : 3 : x ? Will the travel time increase or decrease as the speed of the motorcycle increases? Class 8
Solution:
No. Because by this the travel time will increase instead of decreasing. As speed increases, the travels time decreases.