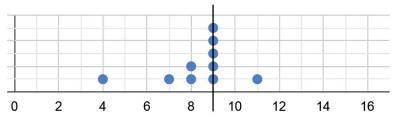
The dot plot below shows a collection of data and its average; but one dot is missing. Mark the missing value so that the mean Class 8
easyThe dot plot below shows a collection of data and its average; but one dot is missing. Mark the missing value so that the mean Class 8
Question 1.
The dot plot below shows a collection of data and its average; but one dot is missing. Mark the missing value so that the mean is 9 (as shown below). Class 8
Solution:
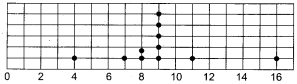
Sum of present 10 values
= 4 + 7 + 2 × 8 + 5 × 9 + 11 = 83
Total of 11 observations with mean 9
= 11 × 9 = 99
So, missing value is 99 - 83 = 16, which has been marked above.
Question 2.
Sudhakar, the class teacher, asks Shreyas to measure the heights of all 24 students in his class and calculate the average height. Shreyas informs the teacher that the average height is 150.2 cm. Sudhakar discovers that the students were wearing uniform shoes when the measurements were taken and the shoes add 1 cm to the height. Class 8
(i) Should the teacher get all the heights measured again without the shoes to find the correct average height? Or is there a simpler way?
(ii) What is the correct average height of the class?
(a) 174.2 cm
(b) 126.2 cm
(c) 150.2 cm
(d) 149.2 cm
(e) 151.2 cm
(f) None of the above
(g) Insufficient information
Solution:
(i) No, just subtract 1 cm from the average height of the class.
(ii) (d) is the correct answer.