The pie chart given below shows the result of a survey carried out to find the modes of transport used by children to go to school. Class 8
easyThe pie chart given below shows the result of a survey carried out to find the modes of transport used by children to go to school. Class 8
Question 1.
The pie chart given below shows the result of a survey carried out to find the modes of transport used by children to go to school. Study the pie chart and answer the following questions. Class 8
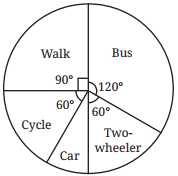
(i) What is the most common mode of transport?
(ii) What fraction of children travel by car?
(iii) If 18 children travel by car, how many children took part in the survey? How many children use taxis to travel to school?
(iv) By which two modes of transport are equal numbers of children travelling?
Solution:
Note : Answer may vary from place to place.
(i) Most common mode of transport is bus.
(ii) Angle for car = 360° - (60° + 90° + 120° + 60°) = 30°.
So, required fraction = [latex]\frac{30}{360}[/latex] = [latex]\frac{1}{12}[/latex]
(iii) Let x children took part in the survey.
So, [latex]\frac{1}{12}[/latex] × x = 18 or x = 12 × 18 = 216.
Number of children using taxis (two wheelers) = [latex]\frac{60}{360}[/latex] × 216 = 36.
(iv) Two modes by which the equal number of children go are cycle and two wheelers.
Note : In fact, none of the children use taxis, according to the given pie chart.
Question 2.
Three workers can paint a fence in 4 days. If one more worker joins the team, how many days will it take them to finish the work? What are the assumptions you need to make? Class 8
Solution:
Let the work will be finished by 4 workers in x days.
There is inverse proportion here.
So, 3 × 4 = 4 × x
or x = [latex]\frac{3 \times 4}{4}[/latex] = 3 days.
We have assume that number of workers and time required are inversely proportional.