Data Handling and Presentation Class 6 Long Question Answer
easyData Handling and Presentation Class 6 Long Question Answer
Data Handling and Presentation Class 6 Long Question Answer
Questions 1.
The sale of electric bulbs on different days of a week is shown below :
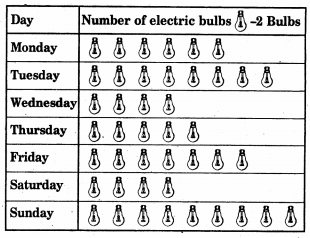
Observe the pictograph and answer the following questions :
(а) How many bulbs were sold on Friday?
(b) On which day were the maximum number of bulbs sold?
(c) On which of the days same number of bulbs were sold?
(d) On which of the days minimum number of bulbs were sold?
(e) If one big carton can hold 9 bulbs.
How many cartons were needed in the given week?
Solution:
Looking at the given pictograph, we can conclude that :
(a) 14 bulbs
(b) Sunday
(c) Wednesday and Saturday
(d) Wednesday, and Saturday
(e) [latex]\frac{43 \times 2}{9}[/latex] =[latex]\frac{86}{9}[/latex] = 9[latex]\frac{5}{9}[/latex] = 10 big cartons.
Questions 2.
Number of children in six different classes are given below. Represent the data on a bar graph.
| Class | 5th | 6th | 7th | 8th | 9th | 10th |
| No. of children | 135 | 120 | 95 | 100 | 90 | 80 |
(a) How would you choose a scale ?
(b) Answer the following questions :
(i) Which class has the maximum number of Children? And the minimum?
(ii) Find the fraction of students of class sixth to the students of class eighth.
Solution:
(a) Start the scale at 0. The greatest value in the data is 135. So, end the scale at a value greater than 135, such as 140. Use equal divisions along the axis, such as increments of 20. Here, we take 1 unit for 20 children.
The bar graph is as under :
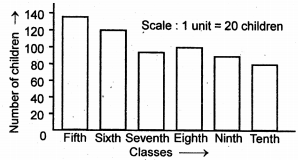
(b) (i) The fifth class has the maximum number of children.
The minimum number of children are in class tenth.
(ii) Fraction of students of class sixth to that of eighth is [latex]\frac{120}{100}[/latex] = [latex]\frac{6}{5}[/latex].